
Last of Two Parts
01/12/2016
This series focuses on evaluating piping systems for which calculated results do not match displayed plant instrumentation. Part 1 ("Troubleshooting Pumps in a System," Pumps & Systems, December 2015) examined the components of the pump and drive, and the conclusion of this series will examine possible causes for an increased discharge pressure.
Reduction in Flow Rate
One possible cause of increased discharge pressure could be a lower flow rate through the pump. The pump curve in Figure 2 shows that decreasing the flow rate causes the pump to operate further back on its curve. This would increase the pump head and discharge pressure.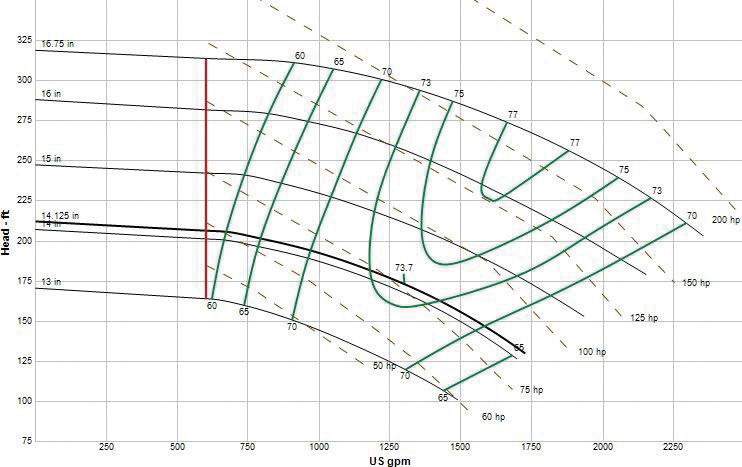 Figure 2. Manufacturer's catalog pump curve for the installed centrifugal pump PU-101, which is a 6x4-17 end suction pump operating at 1,780 revolutions per minute (rpm). The installed pump was supplied with a 14.125-inch impeller by the manufacturer to meet the original design point.
Change of Process Fluid
Another possible cause for a higher pressure is a change in the process fluid. An increase in the density of the process fluid will not affect the pump head, but it will affect the pump's differential pressure. A few quick calculations determined that a density increase of the process fluid from the normal 62 lb/ft3 to 73 lb/ft3 would result in an increase of 16 psi on the pump discharge. The change in fluid density would also cause an increase in the pump suction pressure because of the liquid level in the supply tank. This is a rather small change in suction pressure, and it may be masked by normal system operation. As a result, a change in fluid density is a viable cause for the discharge pressure increase. This change in density could occur with a change in the process fluid, the fluid's concentration or the fluid temperature in tank TK-101 as seen in Figure 1. A discussion with the plant process engineer revealed that no change in process fluid that could have caused an increase in the pump discharge pressure had occurred in the system in the past six months.Increased Impeller Diameter
The operating data shows that an increase of 16 psi for a fluid with a density of 62 lb/ft3 results in an increase of 37 feet of fluid. The supplied pump curve reveals that an impeller diameter of 15 inches results in an increase of approximately 37 feet of pump head. Because changing an impeller's diameter requires disassembling the pump, the plant engineer checked with the maintenance department to see if any work had been performed on the pump. Maintenance records showed that the impeller was replaced four months earlier. The damaged impeller was replaced with an impeller diameter of 15 inches instead of the previously used 14.125-inch diameter.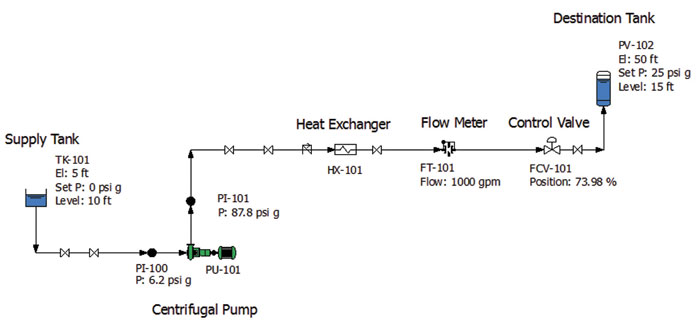 Figure 1. Normal operating conditions for the example fluid piping system as calculated on the piping system model (Graphics courtesy of the author)
 Low Discharge Pressure
In this example, we investigate the possible causes of low discharge pressure in the same pumping system, and through the process of elimination we will narrow in on the probable cause. The system represented in Figure 1 has two identical pumps in parallel. One pump is operating and the other is on standby. The pumps are alternated each month to balance the number of operating hours between them. After shifting from the PU-101A to the PU-101B pump, the plant operator checked the system. Table 1 compares the observed results with the validated results. The discrepancy was turned over to the plant engineer to troubleshoot.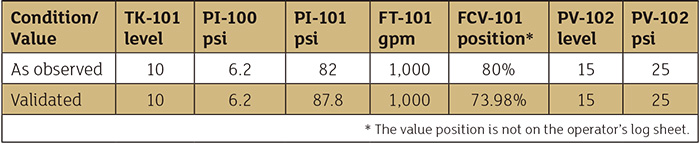 Table 1. Comparison of observed plant instrumentation with the validated piping system model