Blend institutional knowledge with data-driven technologies for improved operations, even with limited information.
Arundo Analytics

The pump industry depends on static laboratory test data and physical simulation models to understand expected pump performance for any given application. However, pump systems are complex, and real-world implementations may deviate significantly from pump performance curve estimates. This limitation affects pump system designers, installers and end users alike, with economic, engineering, maintenance and performance implications. Today, thanks to the increasing prevalence and usability of advanced analytical methods, companies can use sensor data to augment more traditional methods of understanding expected pump performance in real-world circumstances.

Several technology trends are revolutionizing the ability to assess and understand pumping systems in field-deployed applications. These include the wide availability and declining cost of sensors, bandwidth, data storage and computing capabilities. The combination of these technologies enables the application of advanced data-driven approaches, such as machine learning, to complement traditional physics-based understanding of equipment performance. This approach enables improvements in both speed and accuracy of pump performance predictions.

Ideally, machine learning models are trained on substantial data collections gathered during varying operational conditions, preferably reflecting a representative universe of potential events. For all labeled failure modes present in the historical data, models can be trained to detect and predict similar events. However, for greenfield installations or newly instrumented equipment, data is often sparse, and quality, representative, balanced and labeled data is rarely available. Particularly for pumps, it is a challenge to build analytics solutions based on limited operational data so end users have an estimated performance baseline for condition assessment.

Using Subject Matter Expertise

For decades, the pump industry has established an extensive knowledge base through standardized testing, physical simulation and tribal knowledge of an experienced workforce. Combining engineering knowledge with established machine learning techniques allows users to generalize and operationalize the factory test-performance results to serve as an improved reference for estimating the performance of real system installations. Provided that actual operational conditions are not drastically different from available test conditions, such an estimate should result in a valuable guide for optimizing performance and detecting operational failures.

Consider the practical case of performance mapping for a centrifugal pump. The first step is obtaining expected and actual data points. Actual performance data points are extracted from real installed system measurements. Expected pump performance is obtained from manufacturer pump performance curves. Expected performance curves are digitized and scaled by application of pump affinity laws to a broader range of operational conditions to train a machine learning model on the extracted data set. For given operating conditions, i.e. flow rate and machine speed, the machine learning model returns the expected performance at ideal conditions.

pump performance
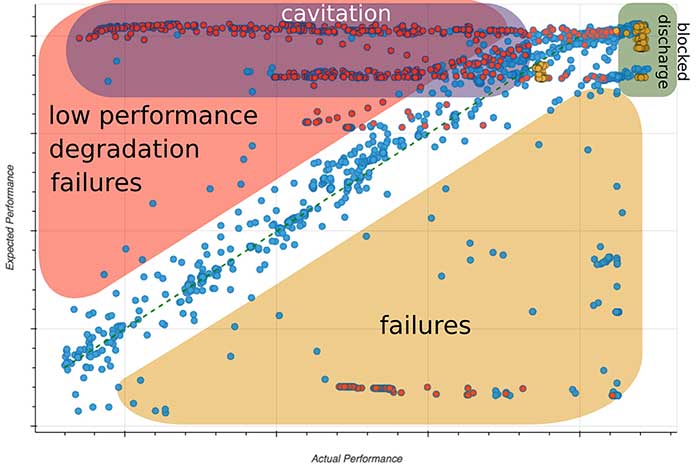
Image 1. Actual (recorded) versus expected (estimated) pump performance deviations. Note: red = cavitation; yellow = discharge blocking (Images courtesy of Arundo Analytics)

By applying that model to live operational data, the deviation between expected and actual performance can be assessed, as shown in Image 1. In the case of a perfect match between actual and expected performance, all points would lie along the dashed line with unit slope. The distance of data points from this line of unit slope indicates the corresponding difference between actual performance to expectation, as indicated in the diagram.

Contextually assessing deviations with regard to associated time intervals and magnitudes further allows us to relate deviations to the following three underlying causes, with associated opportunities in applying advanced analytics
going forward.

1. Ideal Test Environment Conditions vs. Installed System

Pump performance curves are based on test condition data. However, pump applications rarely mimic the actual environment of the test lab, and therefore performance curves must encompass a relatively wide set of values. Without question, many pump system installations deviate significantly from performance curve expectations as a result of interaction with the individual installed system (e.g. piping), as well due to different working fluids that shift internal flow patterns, or simply varying ambient conditions. However, without significant historical experience and collected data from a specific pump installation, it is difficult to derive an application-specific system performance curve. Thus, unique pump systems, newly instrumented systems, or greenfield installations all suffer from a limited understanding of how the actual pump system will perform relative to benchmark performance curves. Accordingly, expected performance might exceed or underestimate real system installation performance. However, these deviations are associated with a systematic shift between expected and actuals. In general, pump performance depends on a large number of parameters that are hard to capture by conventional methods, such as design, operational and environmental factors. While conventional pump curves capture the first order functionality, forward application of advanced analytics allows for calibrating manufacturing maps based on limited operational data points to the individual system at hand, eventually allowing operators to improve operation settings.

2. Machine Degradation Over Time

Operational equipment wears over time, resulting in performance degradation. Degradation is associated with a slow shift of measured points toward lower machine performance over longer periods of time. For the assessment of machine degradation, applying pump curves to reference a nonbiased baseline is particularly helpful, allowing comparisons across different operational conditions over longer time periods. Particularly applying recalibrated performance maps, as mentioned in the previous section, allows meaningful machine condition assessment for the individual equipment.

3. Pump Failure Mode Indication

The cases in which deviations between actual and expected performance occur suddenly, with comparatively large magnitudes, indicate equipment failure. In Image 1, failure modes were deliberately induced and labeled (cavitation in red and discharge blocking in yellow). In terms of building more complex analytics, the clustering of certain failures in specific areas of the variable space or domain as indicated in Image 1 is quite beneficial. This allows the use of clustering as an indicator to label different failure modes.

This approach encourages the application of existing domain knowledge to empower the first steps on the digital journey. With more data points available over time, one might reliably generalize actual performance curves to improve performance estimates and also take into account dependence on additional factors. With enough collected data, it is possible to set up a new performance benchmark that would be used to evaluate the degradation of the asset over time.

Data scientists and machine learning experts working hand in hand with subject matter experts offer an opportunity to create valuable data products that immediately add value.

Issue