

Every building with more than five to six stories/floors must have a booster station to provide the required water pressure at the top levels, typically from 30 to 60 pounds per square inch (psi) for all the installed water fixtures, such as toilets, showers, sinks, etc. Each water fixture is assigned an industry-accepted gallons per minute (gpm) flow.
After all the flows are added up, and depending on the building usage—such as an office, hotel or residential property—an appropriate multiplier is used to determine the expected maximum or rated gpm flow.
The required pump head pressure is determined by the height of the building (feet/2.31 = pounds per square inch [psi]) + piping frictional losses + maximum required pressure at the top floor, minus the minimum expected city supply or pump suction pressure.
The building architectural engineering firm now has the necessary “rated” pump head pressure and flow requirements for the booster station. Usually a duplex system mounted on a skid with two 100% pumps or a triplex system with three 50% pumps is used. Prior to the late 1990s, pumps were constant speed, with system pressure controlled by pressure control or pressure reducing valves (PCV or PRV) mounted at each pump discharge. As variable frequency drives (VFDs) improved and became cost competitive with PCV/PRV, they dominated the market with energy savings.
Pressurized bladder tank(s) may be installed, ideally at the top floor, to store a limited amount of high-pressure water, allowing the pump(s) to shut down for intermittent time periods during no or low-flow conditions. They also aid in reducing possible pressure fluctuations when VFDs are used.
The resulting booster station with PCVs definitely provides the rated pressure and flow requirements, but this is typically two to three times more than the actual maximum flows and is accomplished inefficiently, especially at low or normal flows (which is more than 90% of the time).
Upgrade/Replace Booster Stations to Lower Operating Costs
There are three main reasons that allow existing operating costs to be reduced by as much as or more than 75%.
1. The major reason is that now the water flow can actually be measured to determine not only the maximum flow, but also to determine the average flow over any given period of time. Knowing the actual flow range and pressure requirements is always the best and only way to select the right pump(s).
2. A VFD can be used to vary the speed for the changing flow demand. Per the Affinity Laws, a pump operating at 50% of rated revolutions per minute (rpm), drops the rated brake horsepower (BHP) to 12.5% of the maximum. But to be able to generate the required pressure at reduced speeds, the pump must have the proper performance curve characteristics, which is a relatively high head pressure rise from the maximum flow to the no-flow condition. Again, due to the Affinity Laws, the developed pressure drops at the square of the speed ratio, so that even with a small speed reduction, the pump may no longer produce the required system pressure.
3. The newer designed vertical, multistage, all stainless-steel pumps—or vertical, multistage tie bolt pumps that are held together with four long tie bolts—are now available. Purchasing a tie bolt pump with a motor will typically be lower in cost than overhauling an existing pump.
Selecting the Right-Sized Station
This case study involves a high-rise office building completed in the early 1980s that is still using the originally supplied duplex booster station with two 100%, seven-stage vertical turbine pumps, each rated at 300 gpm at 725 feet (314 psi) with the best efficiency point (BEP) at 375 gpm. The motors were rated at 75 horsepower (hp)/3,530 rpm/460 volts/86 full load amps (FLA). Pressure was controlled by PCVs set at 305 psi, with 55 psi normal suction pressure. This project also had large motors and resulted in the most energy savings.
Using a clamp-on ultrasonic flow meter and an amperage data recorder, the continuous flow and amp draw in one-minute intervals was measured over a seven-day period, producing 10,080 data points. Using a spreadsheet, the maximum flow and corresponding amp draw, the calculated averages for both and the amount of time at each of the various flows could then be determined.
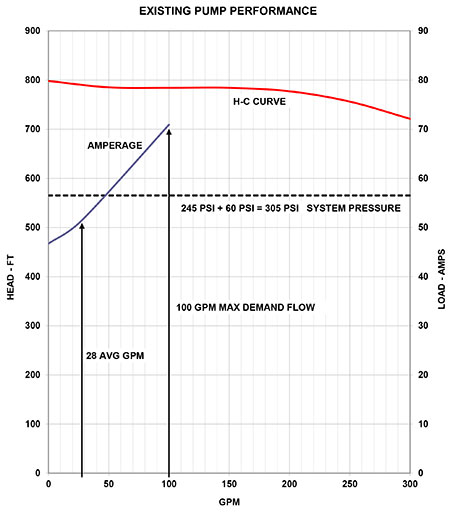 IMAGE 1: Summary of data on existing pump curve (Images courtesy of Pump Tech Solutions)
Most pump curves show BHP versus flow. For this example, motor amperage is used as it is easier to identify and more accurately indicates the actual electrical load, as both the pump and motor efficiency approaches 0%. Actual wire-to-water electrical kilowatts (kW) is never provided on a pump curve because of the many variables with motors and VFDs. But the measured data cannot be disputed in determining real energy costs and comparisons between pumps.
A summary of the collected data below is also included on the existing pump performance curve (Image 1).
- 46.7 amps at 0 gpm (typical 476 volts for all readings)
- 51.5 amps at 28.2 gpm average flow over entire running time
- 70.9 amps at 103 gpm max flow (flows above +70 gpm for 1.7% of total run time)
Note that throughout the entire operating range, the discharge pressure is well above the required system pressure and is all wasted energy. The pump BEP is at 375 gpm, resulting in poor efficiencies when operating at the normal lower flows.
Using the actual flow and head pressure requirements, three pumps were chosen, each rated at 75 gpm at 580 feet/250 psi, with 20-hp motors and 23.5 FLA. See Image 2 for the new performance curve for both 100% speed and the minimum 73% speed.
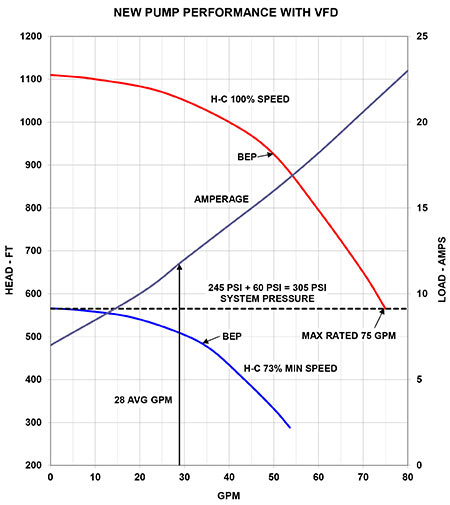 IMAGE 2: New pump performance curve
The amperages shown were taken from the factory test readings at 0 and 70 gpm at 100% speed and corrected for all speed reductions. A near straight line amperage curve is typical as flows increase.
- 7.0 amps at 0 gpm at 73% minimum speed, corrected from 8.7 amps at 100% speed
- 20.3 amps at 70 gpm at 100% speed, estimated 21.8 amps at 75 gpm maximum flow
- 12.0 amps estimated at 28 gpm average flow at estimated 76% speed
Comparing the amperage between the two pumps, it is now easy to estimate the energy cost savings based on the average flow at 28 gpm.
The estimated kilowatts for each pump at 38.2 kW versus 8.9 KW x 42% annual run time x $0.10/kilowatt hour (kWh) = $14,060 versus $3,275 annual electrical cost, results in a 77% reduction of $10,785 yearly cost savings.
Two pumps will be required to run less than 2% of the total running time, with the third pump to provide 100% redundancy should one pump fail or to meet an unusually high flow demand.
Tips for an Energy Efficient System
To design the most energy efficient system, consider the following suggestions:
- Always use VFDs for either a new system or upgrading an existing installation.
- Measure the actual flow demand and corresponding amperage or kW when possible.
- For a new system, use the minimum expected supply/suction pressure. For an existing system, use the expected low suction pressure, which is almost always higher than that estimated for a new building.
- Select maximum flow and head pressure at the far end of the curve, as the pump rarely, if ever, operates there. Cavitation is not an issue, due to the high suction pressure. Ensure that the pump station will not over-pressurize the system at low flows with auto shutdown protection.
- It is OK to partially use the motor 1.15 service factor (SF) for maximum flow rather than increasing the motor hp, as the pump rarely operates there. VFDs can also be programmed to protect against motor overload.
- Triplex system, with three 50% pumps, may be a little more expensive than a duplex with two 100% pumps, but will have lower installed hp and are considerably more efficient at the normally lower flows. Expect 30% of motor FLA at no/low flow, with a VFD at 75% minimum speed.
- Consider bladder tanks for higher hp systems. This project, with a small charge pump for higher bladder pressures, allowed pumps to shut down for 58% of the time over a seven-day period. A small charge pump for bladders is no longer cost effective when VFDs are used.
- If there are no bladder tank(s) and one pump must run 24/7, consider a 30/70/70 or 40/60/60 split. There are low flows more than 75% of the time, and energy savings can be significant. Remember the low flow amp draw is approximately 30% of the motor FLA. Smaller is always lower.
- If a complete system replacement is not an option, consider adding one smaller pump with a VFD to operate independently of the existing system. Or, alternatively, replace one existing pump with a smaller new pump and VFD independently programmed, but powered from the existing controller and using the built-in fault protections. In both cases, the new pump will now be the primary, with the existing in standby.
- Contact the local utility prior to initiating the project to be considered for an energy rebate. This project received a rebate of over $12,000.
As they say with projects like this, there are “many ways to skin the cat,” but these recommendations will go a long way in selecting the right sized booster station that will pay dividends for years to follow.
