

The design and analysis of axial compressors is time and cost-intensive since traditional approaches require many iterations between the cycle analysis step and the final geometry. Modern day cycles and components are often brought to their limits to achieve the highest possible efficiency and lowest fuel consumption. To reach this goal of high efficiency and low consumption, especially in modern gas turbine engines, the pressure ratio of high-pressure compressors (HPC) is constantly increasing. However, this causes higher rotor tip relative Mach numbers in the first stages of the HPC, leading to steep performance characteristic maps. A general performance map of an axial compressor is shown in Image 1.
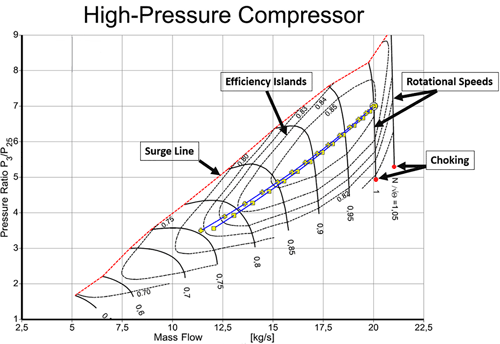
IMAGE 1: Axial compressor map
Performance maps represent the compressor behavior and are used for compressor turbine matching and stall margin evaluations. Maps can also compare different compressors to determine the most suitable design for a given application. These maps usually plot the pressure ratio against corrected mass flow rate and rotational speed. The map has a left bound limit called the surge line and a right bound limit called the choke line. The compressor can predictably operate within these bounds.
These maps are created through physical experiments where early prototypes or final compressor designs are integrated into a test rig with several pressure sensors, mass flow gauges, throttles and several more pieces of testing equipment. This is costly, so the number of tests performed is desired to be low. Additionally, the compressor may pass its surge line if the operator overthrottles the mass flow rate. This can lead to an explosive discharge at the inlet and severe damage. Therefore, with continuously improving computer technology, computational fluid dynamics (CFD) methods are used more and are replacing expensive test rigs, especially in the early stage of the design process. Using CFD brings advantages but is not without disadvantages. An engineer can automate the process of running multiple operating points; however, the process is still slow, requiring a fine mesh to receive accurate results.
The performance maps needed for the full cycle analysis at various operating conditions are only valid for a fixed geometry. This leads to an interesting challenge. As mentioned above, the trend towards higher pressure ratios comes with steeper speedlines. This narrows down the operating range of the compressor, which is undesirable. To improve the situation, variable guide vanes (VGVs) are employed in the first several stages. The metal angle of these vanes can be adjusted according to the current operating point, allowing for a wider operating range. Despite being useful for the final implementation, the design of such compressors is even more difficult. As mentioned, the maps are only valid for a fixed geometry. This means to use VGVs, maps for the various potential angle vane positions need to be generated or only one generates a few maps with different vane angles and applies interpolation methods. This introduces inaccuracies due to the interpolation.
So, how can the process be improved to save time and accelerate the design procedure? Is further improvement even possible? The answer is yes. Companies are now exploring artificial intelligence (AI). AI algorithms have been used in a wide variety of tasks in recent years and are gaining popularity because of the flexibility and high accuracy they can provide. A common example is service chatbots, which answer questions while also learning to find better or more accurate replies throughout their interactions. The same principle can be used in compressor design, as well as design of other turbomachines such as pumps and turbines.
Certain characteristics can be predicted based on a set of data that functions as training data for the AI model. This includes performance maps. Geometrical values such as inlet diameter, vane angles or design point values like pressure ratio or design mass flow rate can be used as inputs, and entire performance maps or an initial compressor geometry can be the output. This would all be decided by the creator of the model, who would determine the exact input and outputs. The training data can consist of new data solely created to train the AI model or existing information built up over a company’s length of operation. New data could also be added to an existing AI algorithm which helps to improve the accuracy of the output. There is a high degree of task flexibility, which is used to accommodate for the various problems or requirements an engineer might have.
Image 2 provides an example of the high-fidelity, time-saving capabilities of AI.
-Pressure-Ratio-and-b)-Efficiency.png)
IMAGE 2: Performance map comparison for pressure ratio (left) and efficiency dots (right): actual data; red lines: AI model predictions1
The image shows the direct comparison of actual data against the AI prediction of a compressor’s pressure ratio and efficiency plot. This is based on a research study presented at Turbo Expo 20221 in which different AI models were developed and compared among them. The points represent the actual data obtained by 3D CFD, whereas the blue and red lines are the AI predictions. They indicate an agreement and demonstrate the possible high accuracy of AI. Now, keep in mind that each point on the map for the actual data was obtained by 3D CFD which, depending on the mesh refinement, can take hours, if not days. The AI output can be obtained in seconds. Additionally, the model was set up in a way to also output an initial compressor geometry for which an example is shown in Image 3.
IMAGE 3: Axial compressor meridional view
To build on this example, in Image 3, the AI could also be tailored to only predict one single point. With this configuration, the AI could then be incorporated into a machine’s cycle analysis directly. Cycle parameters can be taken as an input and pressure ratio, and efficiency can then be provided back to the cycle analysis tool. An example scheme of a jet engine cycle is shown in Image 4.

Here, another time saving aspect exists. By using AI in combination with a cycle analysis tool, it can replace components (compressor, fan, etc.) and provide the value for efficiency directly. This means that the efficiency value no longer needs to be assumed or elaborately determined in an iterative matter, as is often the case in traditional design methods. Furthermore, the efficiency is updated in each component design step and fed back to the cycle analysis. This can be reduced to a few iterations with AI because the AI model provides efficiency immediately based on the training data. It also outputs a matching compressor geometry, which eases the design procedure significantly since the engineer will start with an initial geometry and not from scratch.
While performance maps are typically resource-intensive, especially if variable geometries are included in the compressor and traditional creation methods are used, they are essential for an accurate cycle design and analysis. The use of AI enables engineers to generate maps and compressor geometries much faster than before and will enhance the overall machine design process, as well as the optimization of various components.
References
Burlaka, Maksym. and Moroz, Leonid. “Axial Compressor Map Generation Leveraging Autonomous Self-Training AI.” Proceedings of ASME Turbo Expo 2022
