
There are several ways to control two identical, parallel pumps operating under variable frequency control in pumping applications. One method is to size a single drive to handle both pumps and vary the speed of both synchronously. A more efficient method uses two drives to control the pumps. Once one pump reaches its maximum speed, the second pump is brought online and both are operated at synchronous speeds (as in the previous example). Yet another two-drive method keeps one pump at maximum speed and varies the speed of the other. This example can also be achieved with a single drive and a transfer switch. When the drive reaches full speed, the switch causes a contactor to operate that pump across the line, and the drive is transferred to the second pump. The downside to this control scheme is that there is no back up drive.
The first example can work if the normal flow is always greater than the maximum flow of one pump. Otherwise, it can be inefficient. Examples two and three are better alternatives, but which is best? It depends upon the breadth of a pump's hydraulic efficiency and the system conditions in which it is operating. Comparing these two control schemes to see which can provide the best operating conditions is valuable. The beta version of variable frequency parallel pump analyzer (VFPPA) allows for the comparison of the hydraulic efficiencies of identical, parallel pumps operating under synchronous or independent speed control.
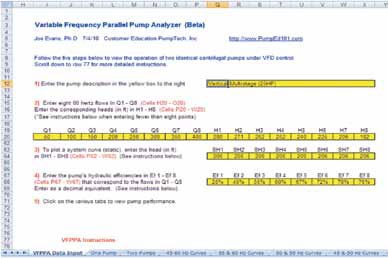
Figure 1. VFPPA Data Input Tab
Figure 1 is a screen shot of the data input tab of VFPPA Excel sheet. It shows the required data (yellow cells) and the tabs that are generated. The “One Pump” tab shows the H/Q curves and hydraulic efficiencies of a single pump at speeds of 45 to 60 Hz. The “Two Pumps” tab shows the same information for two pumps running at synchronous speeds. The other tabs show both single and two-pump operations at different speeds and are used if a more detailed view is required. The Average Efficiency Calculator and the Energy Savings Calculator normally seen at the right of the screen are shown in Figure 4 and will be discussed later.
Synchronous Speed Control
The example included with the analyzer is vertical multistage with a BEP flow of 350 gpm and a BEP efficiency of 78 percent. The rather flat H/Q curve is typical of this design. The system curve shows a required static pressure of 206 feet.
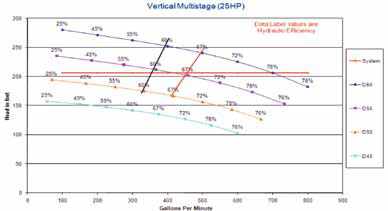
Figure 2. Plot produced by two pumps running at synchronous speeds
Figure 2 is the plot produced in the “Two Pumps” tab and shows the H/Q curves produced from 45 to 60 Hz under synchronous speed control. The data labels show the average hydraulic efficiency. As shown, when both pumps run at full speed (60 Hz), they produce a flow of 700 gpm at 206 ft TDH and operate at BEP efficiency (78 percent). The black angled line is the operating point of both pumps at single pump maximum flow (350 gpm). Speed is approximately 54 Hz and efficiency drops to slightly below 60 percent. As flow (speed) increases, so does the average efficiency of the two pumps. The red angled line crosses the system curve at 450 gpm at a speed of approximately 56 HZ, and efficiency is increased to about 67 percent. Let's take a look at individual speed control and compare the two operating efficiencies at 450 gpm.
Individual Speed Control
Figure 3 is the plot produced in the “One Pump” tab. As shown, a single pump operating at 60 Hz will produce a maximum flow of 350 gpm at 78 percent hydraulic efficiency. Under this control scheme, when the pump reaches maximum flow, it is maintained at full speed and the second pump is brought online at some reduced speed. The red angled line crosses the system curve at 100 gpm at a speed of about 52 Hz. This is the flow that must be provided by the second pump to match the 450 gpm flow produced by two pumps running at synchronous speeds. The hydraulic efficiency at this flow point is about 50 percent.
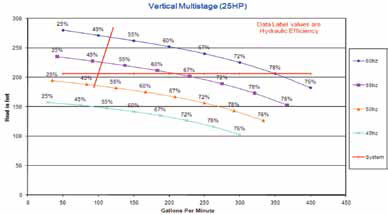
Figure 3. Plot produced by one pump running at 60Hz
Determining the Most Efficient Option
To compare the efficiencies of these two control techniques, the information above is entered into the Average Efficiency Calculator, which is used to determine which control technique is best for a particular pump and application.
The calculator, seen in Figure 4, requires the flow and efficiency of the pump running at full speed and the flow and efficiency of the pump running at a reduced speed. Upon entry, it calculates the percent of total flow contributed by each pump and the average hydraulic efficiency of the two pumps. The calculator shows an average efficiency of 71.8 percent, which is about 5 percent higher than the 67 percent produced at synchronous speed.
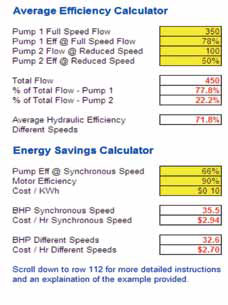
Figure 4. Average Efficiency and Energy Savings Calculators
The Energy Savings Calculator (also in Figure 4) requires the efficiency of the pumps operating at synchronous speed, the motor efficiency and the cost per kW of power. It calculates the total BHP and cost per hour of operation for each control scheme. As shown, synchronous operation requires an additional 2.9 BHP, and the cost per hour is increased by 24 cents.
When the efficiencies of the two control techniques at 400 gpm are compared, individual control trumps synchronous control by about six percentage points, and at 500 gpm, it will still have a one point advantage. As flow increases to 600 gpm, the two efficiencies get closer, but individual control is still higher by about 0.3 percentage points. This trend continues until flow reaches 700 gpm and both control techniques operate at 78 percent.
For this particular pump, individual speed control is the best control choice. For others, synchronous control may work equally as well, or even better. It will depend upon the application and the efficiency range. When three or more pumps operate in parallel, individual speed control should still be compared. However, it will have less of an impact as more pumps are brought online. For example, when the second pump is brought online and operated synchronously, each pump will initially operate at 50 percent of its BEP flow. When a third pump is added, each will begin at 66.6 percent, and if a fourth pump is added, each will begin at 75 percent of BEP flow. These increased minimum flows will also result in an increase in average efficiency.
Now, you may wonder if a savings of $0.24 per hour is worth the trouble. I think that it is if the system operates just above one pump flow for extended periods, even this small savings will add up over several years of operation. Also, the savings can be much larger as application BHP increases. Finally, it costs nothing because both schemes require the same components. Think of it as one small step that when included with others, allows the best possible increase in overall efficiency.
The beta version of VFPPA is available for download from the “Pump Sizing & Selection Tools” section of www.pumped101.com. The final version will support the generation of a system curve that is composed of both static and friction head. It should be available early next year.
Pumps & Systems, October 2010
