
The Jordan, Knauff & Company (JKC) Valve Stock Index was up 8.1 percent over the last 12 months, while the broader S&P 500 Index was up 13.2 percent. The JKC Pump Stock Index increased 1.5 percent for the same time period.1 The Institute for Supply Management’s Purchasing Managers’ Index (PMI) increased slightly in February to 60.8 from 59.1 in January, its highest reading since 2004. The employment component jumped 5.5 points to 59.7. The prices index climbed 1.5 points to 74.2, the highest reading in more than six years. The imports index rose 2.1 points to 60.5, the highest reading since 2007. New orders and production fell slightly, but both remained above 60. U.S. gross domestic product (GDP) expanded at a 2.5 percent annual rate in the last three months of 2017, a deceleration from the third quarter’s 3.2 percent pace. The economy grew 2.3 percent in 2017, above the 1.5 percent seen in 2016. Consumer spending grew 3.8 percent in the fourth quarter, the quickest pace since the last quarter of 2014, following a 2.2 percent rate growth in the third quarter. Growth in business spending on equipment rose 11.8 percent during the fourth quarter, the fastest pace since the third quarter of 2014.
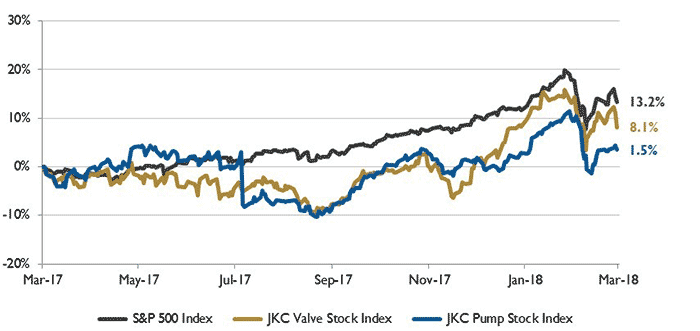 Image 1. Stock Indices from March 1, 2017 to Feb. 28, 2018. Local currency converted to USD using historical spot rates. The JKC Pump and Valve Stock Indices include a select list of publicly traded companies involved in the pump and valve industries, weighted by market capitalization. Source: Capital IQ and JKC research.
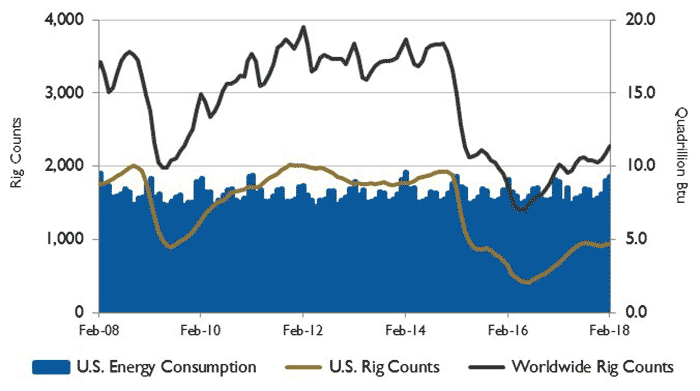 Image 2. U.S. energy consumption and rig counts. Source: U.S. Energy Information Administration and Baker Hughes Inc.
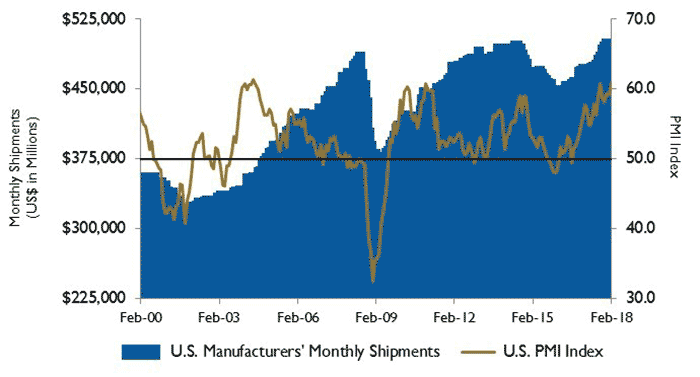 Image 3. U.S. PMI and manufacturing shipments. Source: Institute for Supply Management Manufacturing Report on Business and U.S. Census Bureau