
The Jordan, Knauff & Company (JKC) Valve Stock Index was down 2.5 percent over the last 12 months, while the broader S&P 500 Index was up 7.9 percent. The JKC Pump Stock Index rose 2.3 percent for the same time period.1
The Institute for Supply Management’s purchasing managers’ index (PMI) registered 51.7 percent in June, a decrease of 0.4 percentage points from the May reading of 52.1 percent. June was the third straight month with slowing PMI expansion. New orders hit a 3.5-year low, at 50 percent, a decrease of 2.7 percentage points from May. Production improved over the month, with the index up nearly three points to 54.1 percent. The employment index also edged higher for a second straight month. At 54.5 percent, it represents only modest additions to factory jobs. Respondents expressed concern about United States and China trade issues, potential Mexico trade actions and the global economy.
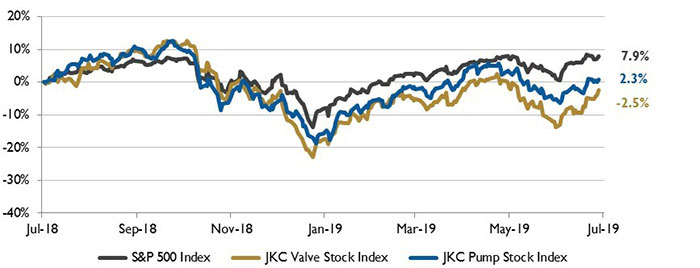 Image 1. Stock Indices from July 1, 2018 to June 30, 2019. Local currency converted to USD using historical spot rates. The JKC Pump and Valve Stock Indices include a select list of publicly traded companies involved in the pump and valve industries, weighted by market capitalization. Source: Capital IQ and JKC research.
According to the Bureau of Labor Statistics, the U.S. economy added 224,000 nonfarm payrolls during June. May’s figures were revised to 72,000 positions, down from the previously reported 75,000. Employment growth has averaged 172,000 jobs per month this year. The transportation and warehousing sector gained 24,000 jobs, while manufacturing added 17,000 positions.
U.S. imports of crude oil from members of the Organization of the Petroleum Exporting Countries (OPEC) in March 2019 totaled 1.5 million barrels per day, their lowest level since March 1986. From the early 1980s through the late 2000s, OPEC member countries were the source of about half of all U.S. crude oil imports. In the past decade, however, total U.S. crude oil imports have fallen and OPEC’s share of those imports has decreased. Non-OPEC countries such as Canada, Mexico, Brazil and Colombia have made up larger shares of U.S. crude oil imports. In each of the past four years, Canada alone has supplied more crude oil to the U.S. than all OPEC members combined.
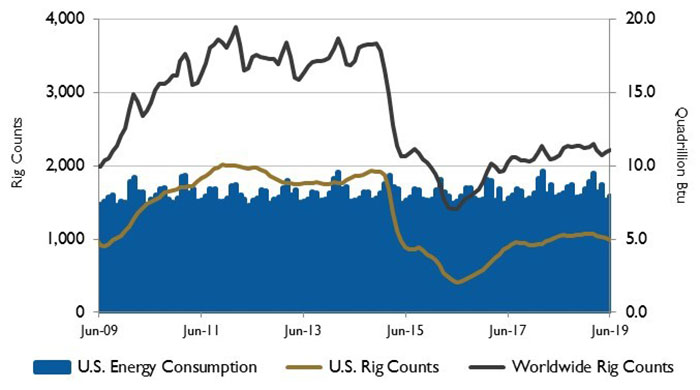 Image 2. U.S. energy consumption and rig counts. Source: U.S. Energy Information Administration and Baker Hughes Inc.
In the first three months of the year, the volume of U.S. crude oil imports from Saudi Arabia and Iraq—the two largest sources of imports from OPEC in 2018—have averaged 26 percent and 28 percent below their 2018 average levels.
On Wall Street, the market had a record-breaking first half of 2019, with the Dow Jones Industrial Average, the S&P 500 Index and the NASDAQ Composite rising 14 percent, 17.4 percent and 20.7 percent, respectively. The S&P 500 had its best first half performance since 1997. Positive developments in the trade war with China, a softer monetary stance by the Federal Reserve Bank and a rebound of crude oil prices due to supply cuts by OPEC and Russia are major reasons for the rally. For June, the Dow Jones Industrial Average, the S&P 500 Index and the NASDAQ Composite gained 7.2 percent, 6.9 percent and 7.4 percent, respectively.
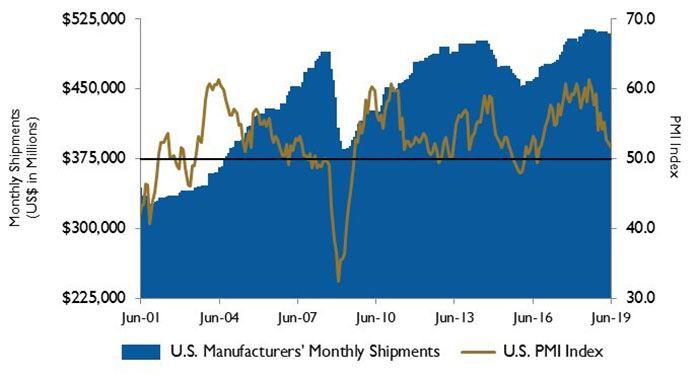 Image 3. U.S. PMI and manufacturing shipments. Source: Institute for Supply Management Manufacturing Report on Business and U.S. Census Bureau
Reference 1. The S&P Return figures are provided by Capital IQ.
These materials were prepared for informational purposes from sources that are believed to be reliable but which could change without notice. Jordan, Knauff & Company and Pumps & Systems shall not in any way be liable for claims relating to these materials and makes no warranties, express or implied, or representations as to their accuracy or completeness or for errors or omissions contained herein. This information is not intended to be construed as tax, legal or investment advice. These materials do not constitute an offer to buy or sell any financial security or participate in any investment offering or deployment of capital.
