

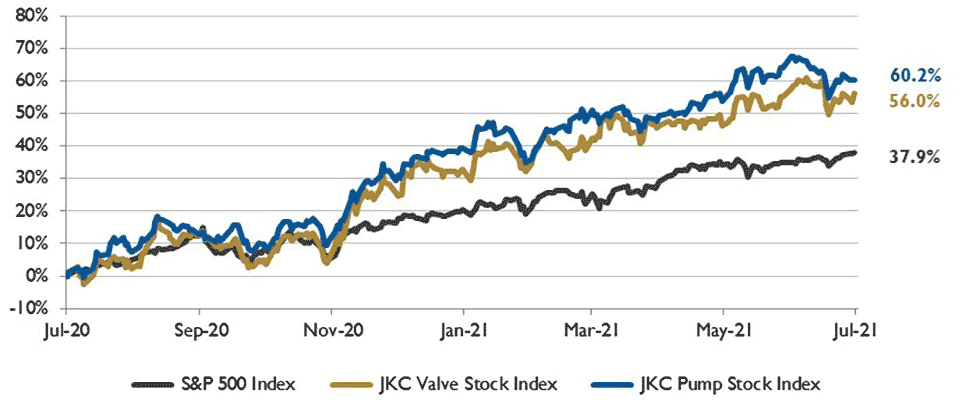
The Jordan, Knauff & Company (JKC) Valve Stock Index was up 56% over the last 12 months, and the broader S&P 500 index was up 37.9%. The JKC pump stock index rose 60.2% for the same period.1
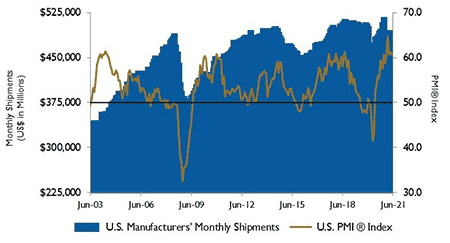
The Institute for Supply Management’s Purchasing Managers Index (PMI) decreased slightly in June to 60.6% from 61.2%. At 92.1%, the Price Index was the highest since 1979, passing the peak in commodities in 2008.
The Production Index rose 2.3 points to 60.8% as wait times for deliveries came down and the Supplier Index fell to 75.1% from 78.8% in May. New orders remained strong at 66%.
The Employment Index dropped one point to fall below the 50% level. Labor remains a challenge across the supply chain, slowing down suppliers or preventing manufacturers from running at full capacity.
The Bureau of Labor Statistics reported total nonfarm payroll employment rose by 850,000 in June, following increases of 583,000 in May and 269,000 in April. Employment is up by 15.6 million since April 2020 but is down 4.4% from its pre-pandemic level in February 2020.
Job gains occurred in leisure and hospitality, public and private education, professional and business services, retail trade and other services.
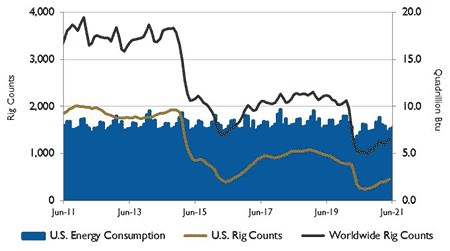
Fossil fuels (petroleum, natural gas and coal) accounted for 79% of total U.S. energy consumption last year. About 21% of U.S. energy consumption in 2020 came from nonfossil fuel sources such as renewables and nuclear, the highest share since the early 1900s. Renewable energy consumption increased to a record high of 11.6 quads. Increases in consumption of renewables used for electricity generation, including wind and solar energy, were partially offset by declines in biofuel consumption in the transportation sector.
So far in 2021, two petroleum liquids pipeline projects have been completed and 17 more projects have been announced or are under construction, according to the U.S. Energy Information Administration. That total includes 12 crude oil projects, six hydrocarbon gas liquids (HGLs) projects and one petroleum product project.
Of the 19 projects, 10 projects are new pipelines, seven projects are expansions or extensions of existing systems and two projects are conversions of the commodity carried on the pipeline. In 2020, 24 petroleum liquids pipeline projects were completed.
On Wall Street, the Dow Jones Industrial Average fell 0.1% while the S&P 500 Index and NASDAQ Composite rose 2.2% and 5.5%, respectively, in the month of June.
For the second quarter of the year, the Dow, the S&P 500 and the NASDAQ grew 8.2%, 4.6% and 9.5% respectively. Vaccinations and government stimulus supported the economy in its recovery from the COVID-19 pandemic in the first half of the year. An uptick in inflation has been a concern for investors.
Read more pump market analysis articles here.
1 - The S&P Return figures are provided by Capital IQ.
