Pump Market Analysis
Jordan, Knauff & Company

The Jordan, Knauff & Company (JKC) Valve Stock Index was up 2.6 percent over the last 12 months, while the S&P 500 Index was up 5.1 percent. The JKC Pump Stock Index fell 15.6 percent in the same time period.1

The Institute for Supply Management’s Purchasing Managers’ Index (PMI) slowed from 59.8 percent in September to 57.7 percent in October, falling below both its six- and 12-month averages. The New Orders index had the largest fallback, declining 4.4 points to 57.4 percent.

This is the first time in a year and a half that new orders have been below 60 percent. The stronger dollar and slowdown in global trade may be affecting manufacturing, as the Export Orders index fell to 52.2 percent, the lowest since 2016.

Stock Indices from Nov. 1, 2017 to Oct. 31, 2018
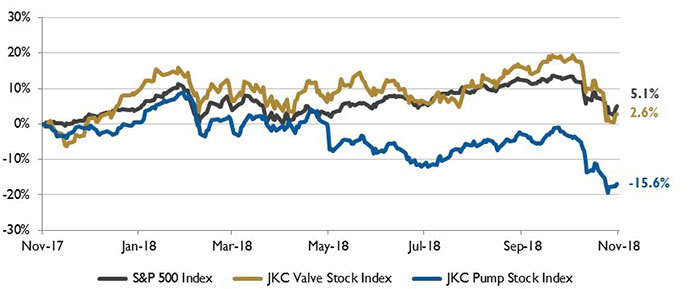
Figure 1. Stock Indices from Nov. 1, 2017 to Oct. 31, 2018. Local currency converted to USD using historical spot rates. The JKC Pump and Valve Stock Indices include a select list of publicly traded companies involved in the pump and valve industries, weighted by market capitalization. Source: Capital IQ and JKC research.

The U.S. economy added 250,000 new jobs in October, keeping unemployment at 3.7 percent, its lowest rate since 1969.

The hiring increase was broad based; no single major industry lost jobs. Manufacturers added 32,000 jobs and construction added 32,000 new employees. The U.S. has added an average of 213,000 jobs a month through October.

U.S. natural gas supply and demand grew in the first half of the year, compared to the first half of 2017. According the U.S. Energy Information Administration, natural gas consumption and exports were 12 percent greater during the first half of 2018 than during the first half of 2017. The largest growth occurred in the residential and commercial sectors, which increased by 16 percent combined due to cold temperatures. Total U.S. natural gas production rose 10 percent in the first half of the year compared to the same period last year. Additional pipeline capacity brought into service since June 2017 enabled production increases.

US energy consumption and rig counts
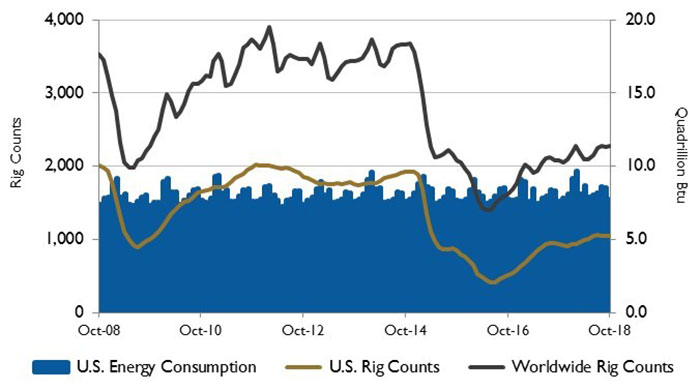
Image 2. U.S. energy consumption and rig counts. Source: U.S. Energy Information Administration and Baker Hughes Inc.

From 2003 to 2007, the value of U.S. energy imports was about 10 times greater than the value of exports. During the past decade, the trade gap for energy products narrowed, and by 2017 U.S. imports were only about 1.5 times greater than exports. Accounting for about two-thirds of the total value of energy imports, the main U.S. energy import is crude oil. Petroleum products, including liquefied petroleum gas, gasoline and diesel fuel, account for another 20 percent of imports. Although exports of crude oil have increased after the removal of crude export restrictions at the end of 2015, petroleum products still accounted for 70 percent of the total value of U.S. energy exports in 2017.

U.S. PMI and manufacturing shipments
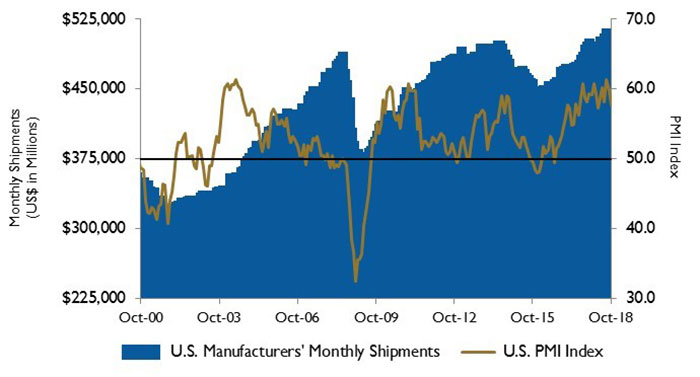
Image 3. U.S. PMI and manufacturing shipments. Source: Institute for Supply Management Manufacturing Report on Business and U.S. Census Bureau.

All three major stock indices were down in October. The Dow Jones Industrial Average lost 5.1 percent, the S&P 500 Index fell by 6.9 percent, while the NASDAQ Composite fell 9.2 percent, its largest monthly fall since November 2008. Investors were concerned about lingering trade conflicts with China, the aggressive monetary policy of the U.S. Federal Reserve Bank and rising yields on government bonds.

Reference
1. The S&P Return figures are provided by Capital IQ.

These materials were prepared for informational purposes from sources that are believed to be reliable but which could change without notice. Jordan, Knauff & Company and Pumps & Systems shall not in any way be liable for claims relating to these materials and makes no warranties, express or implied, or representations as to their accuracy or completeness or for errors or omissions contained herein. This information is not intended to be construed as tax, legal or investment advice. These materials do not constitute an offer to buy or sell any financial security or participate in any investment offering or deployment of capital.