

The Jordan Knauff & Company (JKC) Valve Stock Index was up 12.5% over the last 12 months, while the broader S&P 500 index was up 8.8%. The JKC pump stock index gained 15.1% for the same time period.1
The Institute for Supply Management’s Purchasing Managers Index (PMI) fell to 46.7% in October from the 10-month high of 49% in the previous month and was the eleventh consecutive contraction in the U.S. manufacturing sector. With the 14th straight decline, the contraction in new orders accelerated (45.5% versus 49.2% in September). Input prices fell for the sixth straight month. Survey respondents noted lower demand from both domestic and foreign customers. Production slowed from 52.5% to 50.4%.
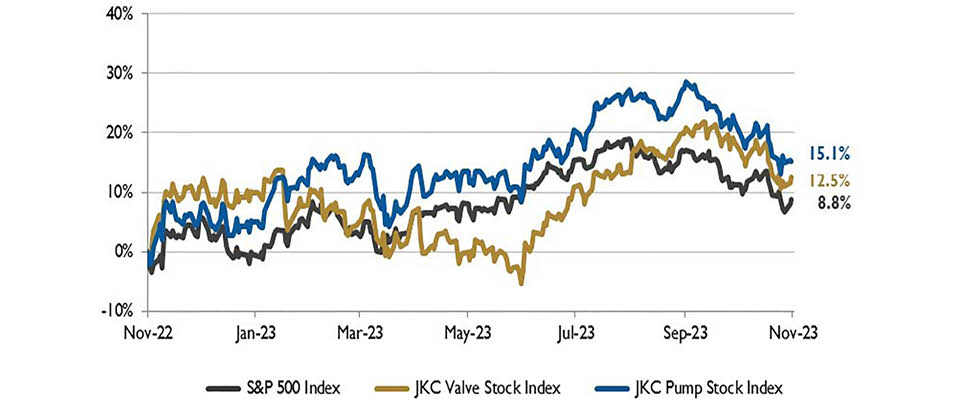
Local currency converted to USD using historical spot rates. The JKC Pump and Valve Stock Indices include a select list of publicly traded companies involved in the pump & valve industries, weighted by market capitalization. Source: Capital IQ and JKC research
The Commerce Department reported gross domestic product (GDP) rose at a seasonally adjusted 4.9% annualized pace in the third quarter of the year, up from a 2.1% pace in the second quarter. The increase marked the biggest gain since the fourth quarter of 2021. The sharp increase was due to consumer spending, increased inventories, exports, residential investment and government spending. Consumer spending, as measured by personal consumption expenditures, increased 4% for the quarter after rising just 0.8% in the second quarter. Consumer spending is split between goods and services, with the two measures up 4.8% and 3.6%, respectively. Inventories contributed 1.3%, gross private domestic investment surged 8.4% and government spending and investment jumped 4.6%.
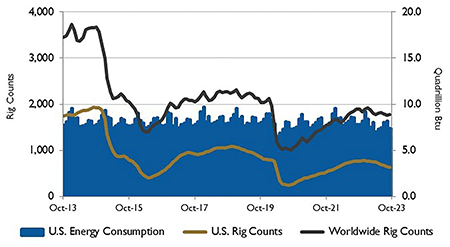
Source: U.S. Energy Information Administration and Baker Hughes Inc.
A production cut from Saudi Arabia and reduced production targets among OPEC+ countries is expected to keep global oil production below global oil consumption next year. As a result, upward pressure on crude oil prices is expected to increase the average Brent spot price to $95 per barrel in 2024.
The number of operating U.S. natural gas rigs has declined 24% since the start of 2023. Producers often decrease their drilling activity when natural gas prices are low, usually taking four to six months to respond to price changes. In 2022, the Henry Hub spot price averaged $6.45 per million British thermal units (MMBtu). The price fell below $4.00/MMBtu in January 2023 and continued to decline throughout 2023, averaging $2.50/MMBtu from January through Oct. 20, almost $4.00/MMBtu less than the average last year.
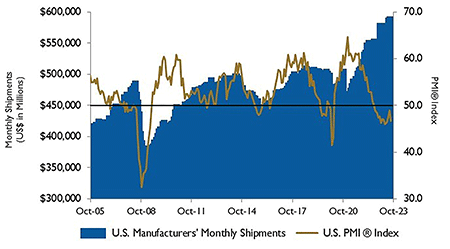
Source: Institute for Supply Management Manufacturing Report
on Business and U.S. Census Bureau
On Wall Street for the month of October, the Dow Jones Industrial Average and the S&P 500 Index declined 1.4% and 2.2%, respectively, marking the first three-month losing streak for both indexes since March 2020. The Nasdaq Composite fell 2.8%, showing its third consecutive negative month. The benchmark 10-year U.S. Treasury yield reached the 5% level for the first time since 2007.
Reference
The S&P Return figures are provided by Capital IQ.
