The Jordan, Knauff & Company (JKC) Valve Stock Index was down 24.4 percent over the last 12 months, while the broader S&P 500 Index was down 0.7 percent. The JKC Pump Stock Index also decreased 20.8 percent for the same time period.1

Stock indices from Jan. 1, 2015, to Dec. 31, 2015.
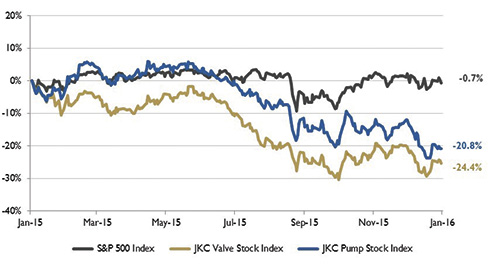
Figure 1. Stock indices from Jan. 1, 2015, to Dec. 31, 2015. Source: Capital IQ and JKC research. Local currency converted to USD using historical spot rates. The JKC Pump and Valve Stock Indices include a select list of publicly traded companies involved in the pump and valve industries weighted by market capitalization.

For the second month in a row the Institute for Supply Management's Purchasing Managers' Index (PMI) remained in contraction territory. The composite index fell to 48.2 percent from 48.6 percent in December. New orders and production were both up slightly for the month but still at contraction levels. Exports increased 3.5 percent to 51 percent for the month, showing expansion for the first time since April. The index for prices declined again and has remained below 50 percent for 14 consecutive months.

Driven by easy credit, cheap gas and pent-up demand, U.S. car sales posted a record high in 2015. Approximately 17.5 million cars and trucks were sold last year, compared with the previous high of 17.3 million in 2000. Sales of light trucks and SUVs increased 13 percent, while sales of passenger cars decreased 2 percent compared with 2014. Ford Motor Company and General Motors both reported 5 percent sales gains, while Fiat Chrysler Automobiles reported U.S. sales increases of 7 percent.

Figure 2. U.S. energy consumption and rig counts
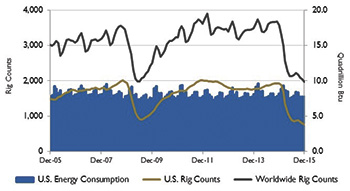
Figure 2. U.S. energy consumption and rig counts. Source: U.S. Energy Information Administration and Baker Hughes Inc.

Global inventories for oil and other liquids increased in each quarter of 2015, resulting in a net inventory build of 1.72 million barrels per day for the year, the highest rate since 1996. Led by production growth in Iraq, total OPEC crude oil and other liquids production increased 3 percent to 37.4 million barrels per day in 2015, according to the U.S. Energy Information Administration. This sustained excess supply over global demand resulted in lower crude oil prices at the end of the year with the price falling below $40 per barrel, the lowest price since early 2009.

The spot price for Brent international crude oil averaged $52 per barrel in 2015, 53 percent below its level in 2014 and 49 percent below the average price over the 2010 to 2014 time period. Spot prices for domestic West Texas Intermediate crude averaged $49 per barrel in 2015, also down 53 percent compared with 2014. U.S. production began to decline in the second quarter of 2015 because of lower crude oil prices. Despite this decline, overall U.S. crude oil production increased 7 percent in 2015 over 2014, reaching the highest level since 1972.

Figure 3. U.S. PMI and manufacturing shipments.
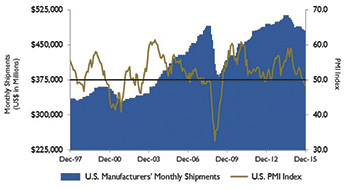
Figure 3. U.S. PMI and manufacturing shipments. Source: Institute for Supply Management Manufacturing Report on Business® and U.S. Census Bureau

On Wall Street, the Dow Jones Industrial Average was down 0.3 percent, the S&P 500 Index decreased 0.3 percent, and the NASDAQ Composite fell 0.6 percent for the month of December. For the full year, the NASDAQ gained 5.9 percent, while the Dow and S&P 500 declined 2.3 percent and 0.7 percent, respectively. Concerns over slowing growth in China and falling oil prices negatively impacted investor sentiment. Consumer spending was strong during the year, making the consumer discretionary sector the largest gainer for the year, which, along with limited exposure to the energy sector, benefitted the NASDAQ.