Pump Market Analysis
Jordan, Knauff & Company

The Jordan, Knauff & Company (JKC) Valve Stock Index was up 20.1 percent over the last twelve months, while the broader S&P 500 Index was up 11.2 percent. The JKC Pump Stock Index increased 23.9 percent for the same period.1

The Institute for Supply Management’s Purchasing Managers’ Index (PMI) increased to a two-year high of 54.7 percentage points in December. The PMI index was at 48.0 level a year earlier in December 2015. Production and new orders surged to above 60 percentage points with production increasing 4.3 points and new orders growing 7.2 points over the prior month. Both of these measures exceeded 60 percentage points for the first time since November 2014.

Stock indices
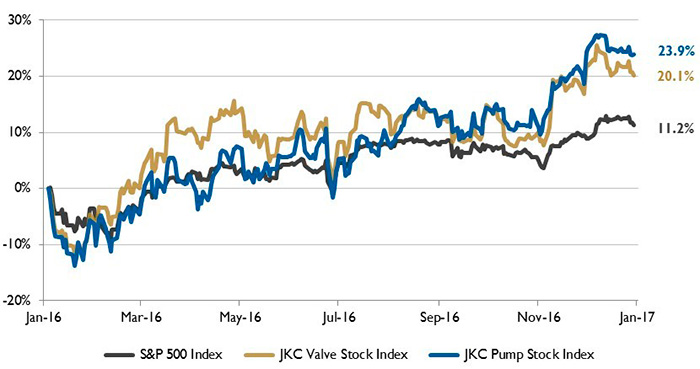
Figure 1. Stock indices from January 1, 2016 to December 31, 2016 Source: Capital IQ and JKC research. Local currency converted to USD using historical spot rates. The JKC Pump and Valve Stock Indices include a select list of publicly traded companies involved in the pump and valve industries weighted by market capitalization.

The Bureau of Labor Statistics reported that nonfarm employment increased by 156,000 jobs in December. Over the past year payroll growth averaged 180,000 jobs per month, below the average of 229,000 jobs per month seen in 2015. Although manufacturing employment rose by 17,000 jobs in December, manufacturing hiring was down by 45,000 workers for the entire year of 2016. The largest employment gains in December were in fabricated metal products with a gain of 5,800 jobs. Motor vehicles and parts, nonmetallic mineral products, furniture, plastics and rubber, primary metals and wood products all added more than 2,000 jobs each during the month.

Crude oil production in the United States declined in 2016 by more than 500,000 barrels per day over 2015, according to estimates from the U.S. Energy Information Administration. Despite the decline, production of crude oil is forecast to average 8.9 million barrels per day in 2016, the second highest level since 1985, and total crude oil exports were up for 2016. The number of countries receiving U.S. exports have risen since the restrictions on crude oil exports were lifted in December 2015.

Energy consumption
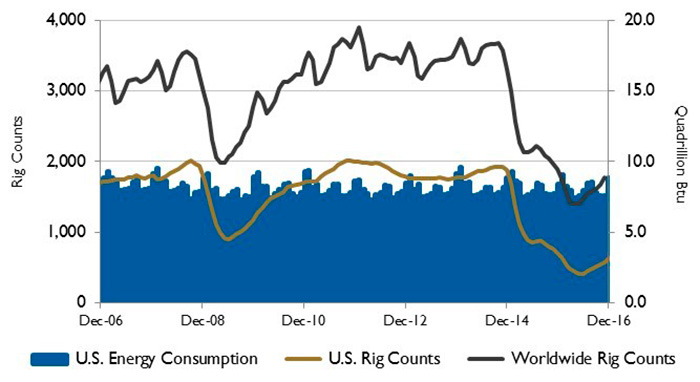
Figure 2. U.S. energy consumption and rig countsSource: U.S. Energy Information Administration and Baker Hughes Inc.

Relatively high production and inventory levels put downward pressure on crude oil prices throughout most of 2016, even with a strong demand for petroleum products. The annual average West Texas Intermediate oil price was $43 per barrel in 2016, down $5 per barrel from 2015. Recent agreements to curb production by OPEC and key non-OPEC producers put upward pressure on prices at the end of the year with West Texas Intermediate pricing ending 2016 at $53 per barrel, $16 per barrel higher than at the end of 2015.

PMI shipments
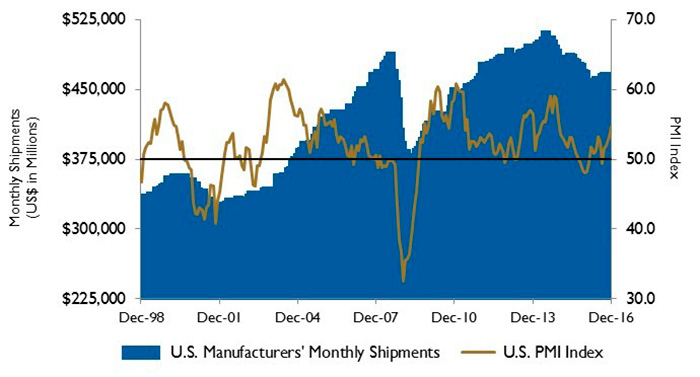
Figure 3. U.S. PMI and manufacturing shipmentsSource: Institute for Supply Management Manufacturing Report on Business and U.S. Census Bureau

On Wall Street for the month of December, the Dow Jones Industrial Average, the S&P 500 Index and the NASDAQ Composite rose 3.3 percent, 1.8 percent and 1.1 percent, respectively. The markets were boosted by the upwardly revised expansion in the U.S. economy during the third quarter, strong manufacturing and services data, along with solid jobs and housing data. For the third quarter, all indices advanced with the Dow gaining 7.9 percent, the S&P 500 up 3.3 percent and the NASDAQ increasing 1.3 percent, also benefiting from OPEC’s decision to cut oil production for the first time since 2008.

Reference

  1. The S&P Return figures are provided by Capital IQ.

These materials were prepared for informational purposes from sources that are believed to be reliable but which could change without notice. Jordan, Knauff & Company and Pumps & Systems shall not in any way be liable for claims relating to these materials and makes no warranties, express or implied, or representations as to their accuracy or completeness or for errors or omissions contained herein. This information is not intended to be construed as tax, legal or investment advice. These materials do not constitute an offer to buy or sell any financial security or participate in any investment offering or deployment of capital.