

The Jordan, Knauff & Company (JKC) Valve Stock Index was up 24.8 percent over the last 12 months, while the broader S&P 500 Index was up 28.9 percent. The JKC Pump Stock Index rose 28.8 percent for the same time period.1
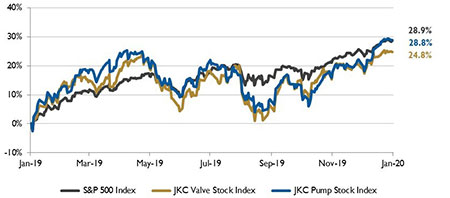 IMAGE 1: Stock Indices from Jan. 1, 2019 to Dec. 31, 2019. Local currency converted to USD using historical spot rates. The JKC Pump and Valve Stock Indices include a select list of publicly traded companies involved in the pump and valve industries, weighted by market capitalization. Source: Capital IQ and JKC research.
The Institute for Supply Management’s Purchasing Managers’ Index (PMI) for December was 47.2 percent, a decrease of 0.9 percentage points and the lowest reading since June 2009. Among the other indices, new orders fell 0.4 percentage points to 46.8 percent; the production index reading was 43.2 percent, down 5.9 percentage points; and the employment index declined 1.5 percentage points to 45.1 percent. Of the 18 manufacturing industries, only three reported growth in December, including miscellaneous manufacturing. While the PMI demonstrated contraction for the fifth straight month, the 12-month average is 51.2 percent.
After declines in three out of the four preceding months, United States. industrial production rose 1.1 percent in November led by the manufacturing component, which comprises three-quarters of all industrial activity. This was the largest monthly increase since February 2018. The gain comes after manufacturing was down in seven of the first 10 months of the year. The level of factory output is down 0.7 percent from a year ago.
The U.S. Energy Information Administration (EIA) expects U.S. crude oil production to average 13.2 million barrels per day (b/d) in 2020, an increase of 0.9 million b/d from the 2019 level. The expected growth is slower than the 2018 growth of 1.6 million b/d and 2019 growth of 1.3 million b/d. The slowing growth is the result of a decline in drilling rigs over the past year, which is expected to continue into 2020.
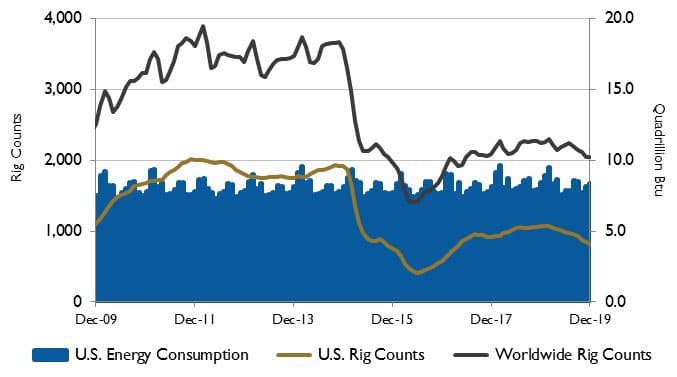 IMAGE 2: U.S. energy consumption and rig counts. Source: U.S. Energy Information Administration and Baker Hughes Inc.
In December, the Organization of the Petroleum Exporting Countries (OPEC) and a group of other oil producers announced they were deepening production cuts. Amid a forecast of rising oil inventories, the EIA forecasts OPEC crude oil production will average 29.3 million b/d in 2020, down by 0.5 million b/d from 2019.
Brent crude oil prices are expected to average $61 per barrel in 2020, down from an average of $64 per barrel in 2019, due to rising global oil inventories, particularly in the first half of the year. West Texas Intermediate prices are forecast to average $55.50 per barrel in 2020.
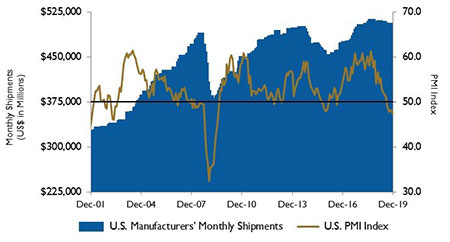 IMAGE 3: U.S. PMI and manufacturing shipments. Source: Institute for Supply Management Manufacturing Report on Business and U.S. Census Bureau
On Wall Street, despite a slump in the manufacturing sector and the lengthy trade war with China, the stock market soared in 2019. The Dow Jones Industrial Average, the S&P 500 Index and the NASDAQ Composite rose 22.3 percent, 28.9 percent and 35.2 percent, respectively for the year. The last three months of the year saw the easing of the China trade war and strong economic data boosting investors’ sentiments. During the month of December, the Dow rose 1.7 percent, the S&P 500 2.9 percent and the NASDAQ 3.6 percent with major indexes closing at new all-time highs.
Reference
1. The S&P Return figures are provided by Capital IQ.
These materials were prepared for informational purposes from sources that are believed to be reliable but which could change without notice. Jordan, Knauff & Company and Pumps & Systems shall not in any way be liable for claims relating to these materials and makes no warranties, express or implied, or representations as to their accuracy or completeness or for errors or omissions contained herein. This information is not intended to be construed as tax, legal or investment advice. These materials do not constitute an offer to buy or sell any financial security or participate in any investment offering or deployment of capital.
