

 IMAGE 1: Stock indices from Dec. 1, 2018 to Nov. 30, 2019. Local currency converted to USD using historical spot rates. The JKC Pump and Valve Stock Indices include a select list of publicly traded companies involved in the pump & valve industries, weighted by market capitalization. Source: Capital IQ and JKC research.
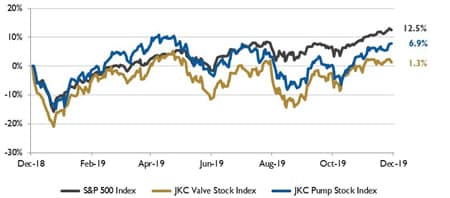
The Jordan, Knauff & Company (JKC) Valve Stock Index was up 1.3 percent over the last 12 months, while the broader S&P 500 Index was up 12.5 percent. The JKC Pump Stock Index rose 6.9 percent.1
The Institute for Supply Management’s Purchasing Managers’ Index (PMI) registered 48.1 percent in November, the fourth straight month below the mark of 50 percent. Of 18 industries surveyed, just five reported growth. New orders fell to 47.2 percent, tying the lowest reading for the current economic expansion, and order backlogs fell to a three-year low of 43 percent. The production index climbed to 49.1 percent. The imports component climbed to 48.3 percent, its highest reading since June. Global trade remains a big cross-industry issue. Among the six big industry sectors, food, beverage and tobacco products remains the strongest, while fabricated metal products the weakest.
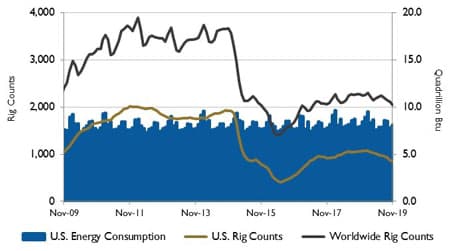 IMAGE 2: U.S. energy consumption and rig counts. Source: U.S. Energy Information Administration and Baker Hughes Inc.
The U.S. economy produced a robust 266,000 new jobs in November and the unemployment rate returned to a 50-year low of 3.5 percent. The increase was partly inflated by the return of 50,000 striking auto workers at General Motors. Health care providers hired 45,000 people, hotels and restaurants hired 45,000 and white-collar professional firms added 31,000 workers. Manufacturers have added few jobs this year, hurt by a slowing global economy and by the U.S. trade war with China. Over the past three months, the economy added an average of 205,000 new jobs, down from a 223,000 average in 2018.
The U.S. set new records in natural gas production, consumption and exports in 2018. Driven by increased natural gas consumption in the electric power sector, U.S. natural gas consumption increased by 11 percent. Dry natural gas production increased by 12 percent, reaching a record-high average of 83.8 billion cubic feet per day (Bcf/d). The increase was the largest percentage increase since 1951 and the largest volumetric increase since 1930. Natural gas gross exports totaled 10.0 Bcf/d in 2018, 14 percent more than in 2017. Several new liquefied natural gas (LNG) export facilities came online in 2018, allowing for more exports.
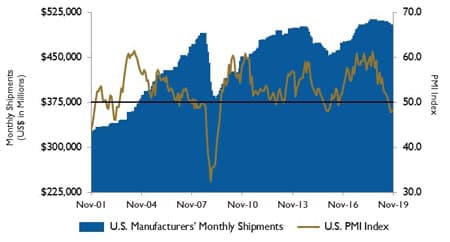 IMAGE 3: U.S. PMI and manufacturing shipments. Source: Institute for Supply Management Manufacturing Report on Business and U.S. Census Bureau
U.S. natural gas production growth was concentrated in the Appalachian, Permian and Haynesville regions. Pennsylvania and Ohio had the first- and third-largest year-over-year increases for 2018, increasing by 2.0 Bcf/d and 1.7 Bcf/d, respectively. Louisiana had the second-largest volumetric increase in dry production, increasing by 1.8 Bcf/d as a result of increased production from the Haynesville shale formation.
The Dow Jones Industrial Average increased 3.7 percent, the S&P 500 Index rose 3.4 percent and the NASDAQ Composite gained 4.5 percent in November, marking the second-best month for stocks in 2019. Increased negotiations between U.S. and Chinese officials to reach to a temporary trade deal along with a solid U.S. economy boosted investors’ confidence.
Reference
1. The S&P Return figures are provided by Capital IQ.
These materials were prepared for informational purposes from sources that are believed to be reliable but which could change without notice. Jordan, Knauff & Company and Pumps & Systems shall not in any way be liable for claims relating to these materials and makes no warranties, express or implied, or representations as to their accuracy or completeness or for errors or omissions contained herein. This information is not intended to be construed as tax, legal or investment advice. These materials do not constitute an offer to buy or sell any financial security or participate in any investment offering or deployment of capital.
