

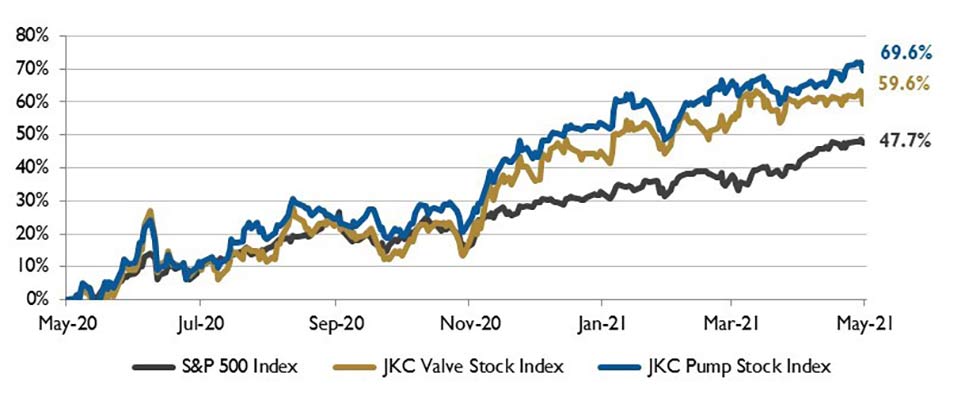
The Jordan, Knauff & Company (JKC) Valve Stock Index was up 59.6% over the last 12 months, and the broader S&P 500 index was up 47.7%. The JKC pump stock index rose 69.6% for the same period.1
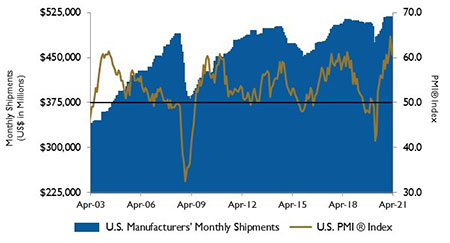
The Institute for Supply Management’s manufacturing index (PMI) fell to 60.7% in April from 64.7% in March. The Backlog of Orders Index surged to a record high of 68.2%. New orders slowed to a still-high 64.3% in April from 68.0% in March, even as manufacturers struggle to keep up with demand.
The largest decline was a 5.6 percentage point drop in the Production Index, which fell to 62.5%. Hiring slowed in April, with the Employment Index slipping to 55.1%. The Prices Index rose 4 percentage points to 89.6%.
The United States Department of Commerce reported that gross domestic product (GDP) grew at an annualized rate of 6.4% in the first quarter of the year driven by personal consumption, which rose 10.7%.
Specifically, business spending on equipment rose 16.7%, and spending on intellectual property grew 10.1%. Strong growth in these areas reflects upgrades to equipment and software needed to support employees working remotely. Residential investment rose 10.8% (annualized), while purchases of durable and nondurable goods jumped 41.4% and 14.4%, respectively. Spending on services rose 4.6%. GDP is now only 0.9% shy of its pre-pandemic level.
The ports of Los Angeles and Long Beach, California, which together handle more than a third of all U.S. seaborne imports, had their busiest March on record. The months-long logjam of cargo ships at these ports appears to be easing. In mid-April, 23 ships were waiting to dock, down from around 40 in February. These ships are waiting days before unloading, causing manufacturers to wait for months for goods.
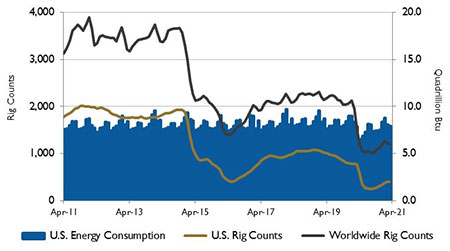
The U.S. exported more energy than it imported for the second consecutive year in 2020. Energy exports exceeded imports by 3.4 quadrillion British thermal units (quads) in 2020, the largest margin on record. U.S. energy imports fell 13% to 20.0 quads, the lowest level since 1992, while exports totaled 23.4 quads, almost the same as the record high set in 2019.
After increasing every year since 2010, U.S. crude oil exports reached another record high in 2020 at 3.2 million barrels per day (b/d). U.S. crude oil imports fell to 5.9 million b/d, the lowest since 1991.
On Wall Street, the Dow Jones Industrial Average was up 2.4% month over month, the S&P 500 Index rose 5.6% and the NASDAQ Composite was up 7.0%.
The policies of the Federal Reserve Bank, fiscal stimulus, strong first-quarter corporate earnings results and the strong recovery of the U.S. economy contributed to the strong performance. Concerns continued regarding the high valuation of equities and the resurgence of COVID-19 in India, Brazil and Turkey.
Read more Market Analysis articles here.
Reference
1. The S&P Return figures are provided by Capital IQ.
These materials were prepared for informational purposes from sources that are believed to be reliable but which could change without notice. Jordan, Knauff & Company and Pumps & Systems shall not in any way be liable for claims relating to these materials and makes no warranties, express or implied, or representations as to their accuracy or completeness or for errors or omissions contained herein. This information is not intended to be construed as tax, legal or investment advice. These materials do not constitute an offer to buy or sell any financial security or participate in any investment offering or deployment of capital.
