

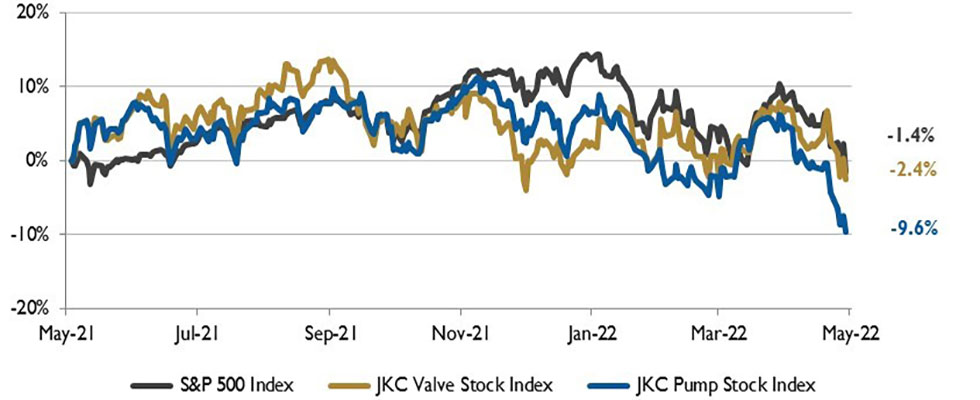
The Jordan, Knauff & Company (JKC) Valve Stock Index was down 2.4% over the last 12 months, and the broader S&P 500 index was down 1.4%. The JKC pump stock index fell 9.6% for the same period.1
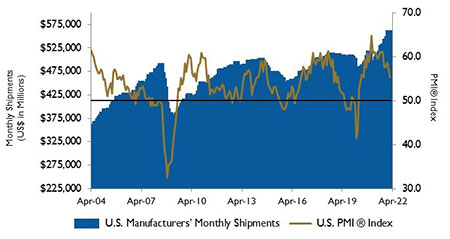
The Institute for Supply Management’s Purchasing Managers Index (PMI) fell 1.7 percentage points to 55.4% in April, the lowest reading in over 18 months. Supplier deliveries rose 1.8 percentage points to its highest value in five months at 67.2%.
Survey respondents commented that constrained supply was impacting activity. The inventory index fell nearly 4.0 percentage points as manufacturers are still struggling to get inputs amid COVID-related restrictions in China. The new orders index declined to 53.5% and the employment index fell to 50.9%.
The Labor Department reported 11.5 million job openings in March. The number of workers who quit jobs rose to a record high of 4.5 million, slightly higher than the previous record in November 2021. Job postings at employers with more than 5,000 workers have more than doubled since February 2020. Job openings reached their highest levels on record in the South.
The U.S. gross domestic product (GDP) declined at a 1.4% annual rate for the first quarter of the year, a sharp reversal from a 6.9% annual growth rate in the fourth quarter of last year. Declines in fixed investment, defense spending and the record trade imbalance weighed on growth. Companies spent more on equipment and research and development, causing a 9.2% rise in business spending.
In 2021, U.S. natural gas production increased 2% and, in December 2021, reached the highest production level on record. Three regions drove this growth: Appalachia, Permian and Haynesville, which collectively accounted for 59% of gross withdrawals in 2021 compared with 24% in 2011.
China’s liquefied natural gas (LNG) imports increased 19% last year, as it became the world’s largest importer of LNG. Prior to 2021, Japan had been the world’s largest LNG importer for decades. Australia, United States, Qatar, Malaysia, Indonesia and Russia provided 85% of China’s total LNG imports.
New LNG contracts between China and the U.S. are expected to begin in 2022 and 2023. The U.S. was the largest supplier of spot LNG volumes to China last year.
On Wall Street, the Dow Jones Industrial Average and the S&P 500 Index fell 4.9% and 8.8%, respectively, in April. The NASDAQ Composite lost 13.3%, recording its worst monthly performance since October 2008.
The Federal Reserve raised interest rates by 25 basis points in March, its first hike since 2018, in order to check surging inflation. Investors were concerned with lockdowns in China due to surging COVID-19 cases, and the supply chain crisis, exacerbated by the Russia-Ukraine war, also disrupted businesses.
Reference
1 - The S&P Return figures are provided by Capital IQ.
