

The Jordan Knauff & Company (JKC) Valve Stock Index was up 0.2% over the last 12 months, and the broader S&P 500 index was up 0.3%. The JKC pump stock index gained 8.7% for the same time period.1
The Institute for Supply Management’s Purchasing Managers Index (PMI) was 47.1% in April, 0.8 percentage points higher than the 46.3% recorded in March.
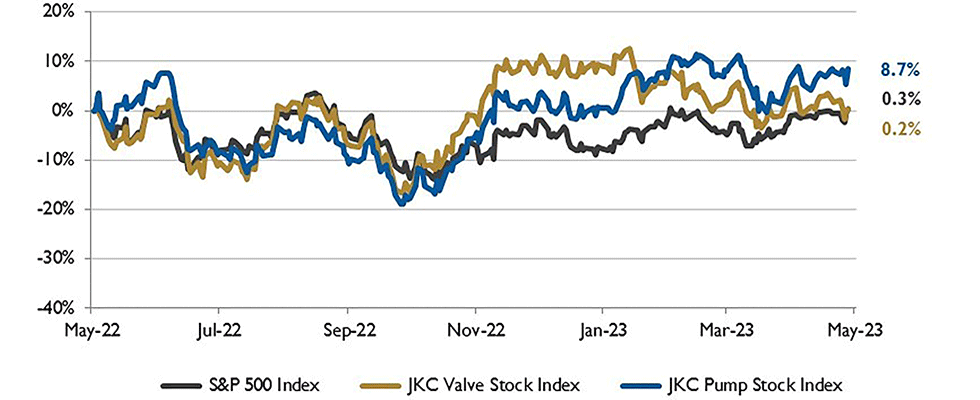
Local currency converted to USD using historical spot rates. The JKC Pump and Valve Stock Indices include a select list of publicly traded companies involved in the pump & valve industries, weighted by market capitalization. Source: Capital IQ and JKC research.
This reflects a fifth month of contraction after a 30-month period of expansion. The New Orders Index remained in contraction territory at 45.7% but was 1.4 percentage points higher than March. The Production Index reading of 48.9% was a 1.1 percentage point increase compared to the month earlier.
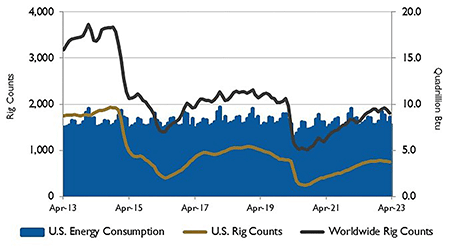
Source: U.S. Energy Information Administration and Baker
Hughes Inc.
The Employment Index rose into expansion territory, registering 50.2%, up 3.3 percentage points from March’s reading. The five industries reporting growth in April were: printing and related support activities; apparel, leather and allied products; petroleum and coal products; fabricated metal products and transportation equipment.
The United States Bureau of Labor Statistics reported nonfarm payrolls grew by 253,000 in April. Despite the ongoing challenges in the factory sector, manufacturing employment rose by 11,000, reversing the 8,000 loss in March. Nonfarm payrolls have grown at an average of 285,000 jobs per month this year, and the labor force participation rate has increased 0.3 percentage points since the end of 2022. Average hourly earnings grew 0.5% in April. Over the past three months, average hourly earnings have risen 4.2%.
Inflation, as measured by the consumer price index, eased to 5% in March, on an annual basis, down from 6% in February. Energy and food prices declined in March. Grocery prices fell 0.3%, the first monthly decline since September 2020. Housing was an inflation driver in March and over the past year, increasing 8.2%.
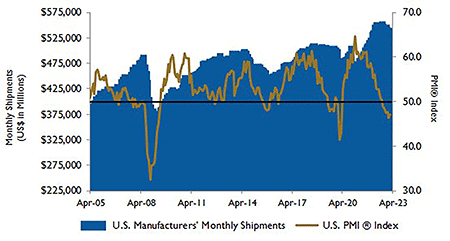
Source: Institute for Supply Management Manufacturing Report
on Business and U.S. Census Bureau
Strong continuing international demand for petroleum and other liquids will support U.S. production of these products above 2022 levels through 2050, according to the U.S. Energy Information Administration’s (EIA) Annual Energy Outlook 2023. Modest growth in U.S. production of petroleum and other liquids is expected through 2050, increasing about 10% from 2022. In addition, the EIA projects the U.S. will continue to be an integral part of global oil markets, and a significant source of supply, as increased exports of finished products support U.S. production.
On Wall Street for the month of March, the Dow Jones Industrial Average gained 2.5%, the S&P 500 Index rose 1.5% and the Nasdaq Composite was flat.
Personal consumption expenditure inflation, the Federal Reserve Bank’s preferred inflation metric, was 0.3% for March and in line with expectations.
Reference
1 - The S&P Return figures are provided by Capital IQ.
