

The Jordan, Knauff & Company (JKC) Valve Stock Index was up 1.9 percent over the last 12 months, while the broader S&P 500 Index was up 19.1 percent. The JKC Pump Stock Index rose 7.8 percent for the same time period.1
After being in contraction for five months, The Institute for Supply Management’s Purchasing Managers’ Index (PMI) jumped to 50.9 percent in January from 47.8 percent in December. New orders increased to 52 percent from 47.6 percent, while production grew 9.5 percentage points to 54.3 percent from 44.8 percent in December.
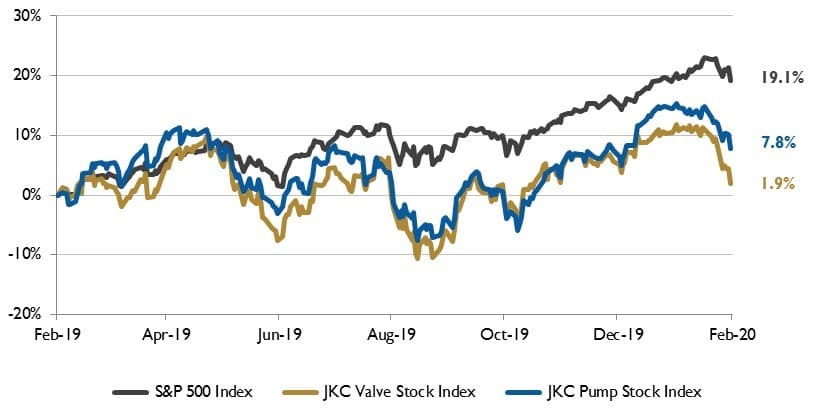 IMAGE 1: Stock Indices from Feb. 1, 2019 to Jan. 31, 2020. Local currency converted to USD using historical spot rates. The JKC Pump and Valve Stock Indices include a select list of publicly traded companies involved in the pump & valve industries, weighted by market capitalization. Source: Capital IQ and JKC research.
 The Employment Index registered 46.6 percent, a 1.4 percentage point increase from the prior month. Despite the signing of a Phase I trade deal with China, survey respondents in multiple industries remain worried about tariffs. According to one respondent, “Tariffs are still a concern and are believed to be a factor in short supply and higher prices of electronic parts.”
Construction spending dipped 0.2 percent in December ending five months of gains. Overall spending for 2019 was 0.3 percent below 2018 levels. Total nonresidential outlays fell 1.2 percent, while the residential sector rose 1.4 percent due to reduced mortgage rates and low lumber prices. Single-family spending rose 2.7 percent, while multifamily dropped 1.8 percent. Public expenditures were strong during 2019 with total spending rising 7.1 percent compared with 2018, the strongest gain since 2007.
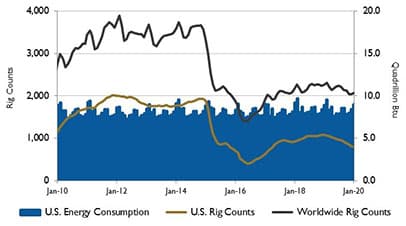 IMAGE 2: U.S. energy consumption and rig counts. Source: U.S. Energy Information Administration and Baker Hughes Inc.
Driven by continued increases in energy efficiency in the end-use sectors, the U.S. Energy Information Administration’s (EIA) Annual Energy Outlook 2020 projects domestic energy demand to grow 0.3 percent per year on average through 2050, slower than the average annual growth in U.S. gross domestic product of 1.9 percent.
This slow growth in U.S. energy consumption, along with technologically enabled growth in domestic oil and natural gas production, will lead the U.S. to remain a net energy exporter through 2050. The U.S. will continue to export more petroleum and other liquids than it imports, with a peak at more than 3.8 million barrels per day (bpd) in the early 2030s before gradually declining to 0.2 million bpd in 2050 as domestic consumption slowly rises.
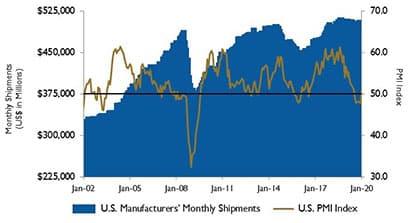 IMAGE 3: U.S. PMI and manufacturing shipments. Source: Institute for Supply Management Manufacturing Report on Business and U.S. Census Bureau
The EIA also projects that U.S. crude oil production will continue to set annual records through the mid-2020s and remain near 14 million bpd through the mid-2040s. It also expects that dry natural gas production will reach 45 trillion cubic feet by 2050.
On Wall Street, the Dow Jones Industrial Average and the S&P 500 Index fell 1 percent and 0.2 percent, respectively, while the NASDAQ Composite rose 2 percent for the month of January.
The signing of the U.S./China Phase I trade deal lifted markets in the first half of the month, while the second half was affected by volatility due to the outbreak of the coronavirus.
1 - The S&P Return figures are provided by Capital IQ.
