

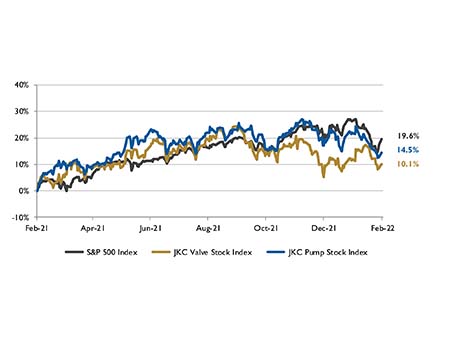
The Jordan, Knauff & Company (JKC) Valve Stock Index was up 10.1% over the last 12 months, and the broader S&P 500 Index was up 19.6%. The JKC Pump Stock Index rose 14.5% for the same time period.1
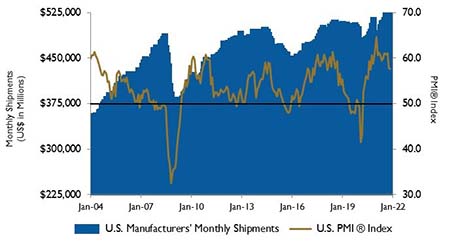
The Institute for Supply Management’s Purchasing Managers Index (PMI) fell 1.2 points to 57.6% in January. The Production Index dropped 1.6 points to 57.8%, showing current activity was weaker. A 3.1 point decline to 57.9% in new orders suggests a decline in demand. Both of these components are at their lowest levels in over a year and a half, signaling weaker activity.
The omicron variant weighed on manufacturing activity in January. Manufacturers seemed to have an easier time securing inputs but finding the help they need remained a challenge. After declining 14.2 points in December, the Prices Index jumped almost eight points to 76.1%. The strain on inputs and the constrained labor supply will keep pressure on prices. The employment index rose 0.6 points to 54.5%.
Real gross domestic product (GDP) increased at an annual rate of 6.9% in the fourth quarter of 2021, according to the first estimate released by the Bureau of Economic Analysis. In the third quarter, real GDP increased 2.3%. A jump in consumer spending during last year’s record holiday shopping season helped contribute to the gain in the fourth quarter. In addition, companies worked to replenish supplies as demand soared. The build in private inventories was led by inventory investment by motor vehicle dealers.
Economic growth was robust throughout 2021 as vaccinations increased and stay-in-place behaviors began to abate. For the full year 2021, GDP grew at 5.7%, marking the fastest rate since 1984. GDP shrank by 3.4% in 2020.
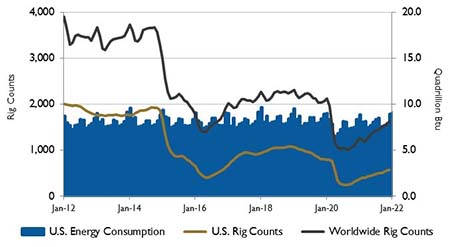
U.S. crude oil production dropped slightly in 2021 but is expected to increase by 6% in 2022 and 5% in 2023. The U.S. Energy Information Administration (EIA) forecasts that crude oil prices will remain high enough in 2022 and 2023 to encourage growth in the number of active drilling rigs and continued improvement in drilling efficiency.
Of the total U.S. fossil fuel production in 2021, dry natural gas accounted for 46%, crude oil accounted for 30%, coal for 15% and natural gas plant liquids for 9%. After declining in 2020, the combined production of U.S. fossil fuels increased by 2% in 2021. The EIA expects U.S. fossil fuel production to continue rising in both 2022 and 2023, surpassing 2019 levels and reaching a new record in 2023.
On Wall Street, the Dow Jones Industrial Average, the S&P 500 Index and the NASDAQ Composite fell 3.3%, 5.3% and 8.9%, respectively, in January. Stocks fell as the Federal Reserve Bank increased the tapering of the quantitative easing program and Chairman Jerome Powell’s indication that the central bank will contain inflation.
1 - The S&P Return figures are provided by Capital IQ.
