

The Jordan Knauff & Company (JKC) Valve Stock Index was up 3.3% over the last 12 months, while the broader S&P 500 index was down 10.3%. The JKC pump stock index fell 2.8% for the same time period.1
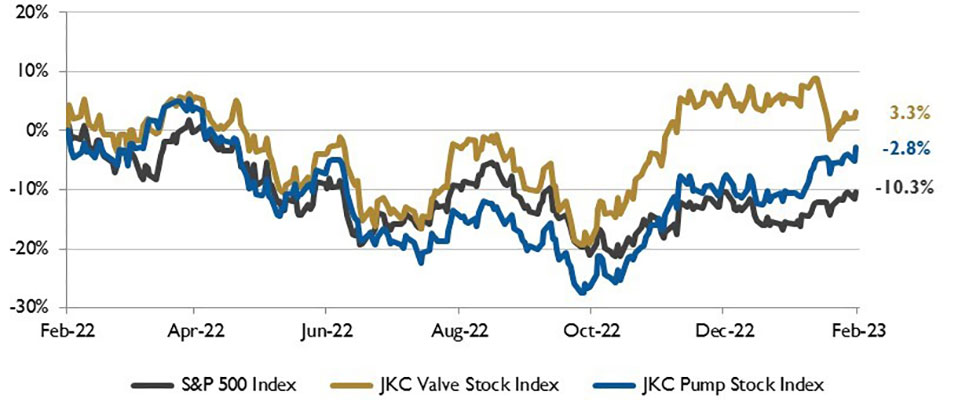
Local currency converted to USD using historical spot rates. The JKC Pump and Valve Stock Indices include a select list of publicly traded companies involved in the pump & valve industries, weighted by market capitalization. Source: Capital IQ and JKC research.
The Institute for Supply Management’s Purchasing Managers Index (PMI) fell to 47.4% in January, one point lower than the 48.4% recorded in December. The figure is the lowest since May 2020, when it registered 43.5% and the continuation of a downward trend that began in June 2022. The New Orders Index remained in contraction territory at 42.5%, 2.6 percentage points lower than the prior month. The Production Index reading of 48.0% was a slight decrease compared to December.
The Prices Index was up 5.1 percentage points to 44.5%. The Employment Index continued in expansion territory, at 50.6%, after emerging from contraction territory in November. Two industries reported growth in January: miscellaneous manufacturing and transportation equipment. A survey respondent from the transportation equipment industry commented, “Supply chain issues continue to plague our production schedules. … Lead times have doubled for critical electronics, gaskets, sealants and specialized steel.”
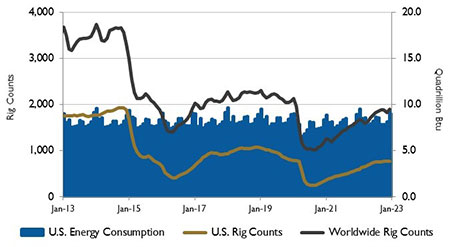
Source: U.S. Energy Information Administration and Baker
Hughes Inc.
Gross domestic product (GDP) in the United States grew at an annualized rate of 2.9% in the final quarter of 2022, a downturn from the 3.2% growth rate in the third quarter. Increases were seen in private inventory investment, consumer spending, government spending and nonresidential fixed investment.
The increase in private inventory investment was led by manufacturing along with mining, utilities and construction industries. The increase in consumer spending reflected increases in both services and goods.
The U.S. Energy Information Association forecasts crude oil production in the U.S. will average 12.4 million barrels per day (b/d) this year and 12.8 million b/d next year, surpassing the previous record of 12.3 million b/d set in 2019. The growth is primarily due to increased production in the Permian region.
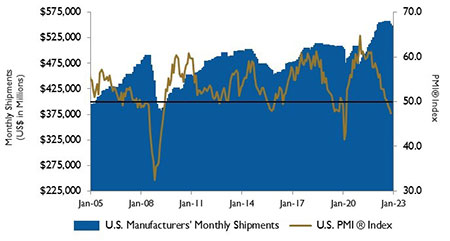
Source: Institute for Supply Management Manufacturing Report
on Business and U.S. Census Bureau
The U.S. benchmark West Texas Intermediate (WTI) crude oil price is expected to average $77 per barrel (b) in 2023, down from $95/b in 2022. The global benchmark Brent price is forecast to average $83/b in 2023, down from $101/b in 2022.
Despite declining crude oil prices, the WTI price is expected to remain high enough to support crude oil production growth, especially in the Permian, where the Dallas Fed Energy Survey indicates that average breakeven prices range from $50/b to $54/b.
The Dow Jones Industrial Average, the S&P 500 Index and the Nasdaq Composite rose 2.8%, 6.2% and 10.7%, respectively, in January. The Dow and the S&P 500 had their third positive month out of four. The S&P 500 posted its best January since 2019.
Favorable inflation data and a resilient labor market boosted investors’ sentiment.
Reference
1 - The S&P Return figures are provided by Capital IQ.
