
10/20/2015
The Jordan, Knauff & Company (JKC) Valve Stock Index was down 27.0 percent over the last 12 months, while the broader S&P 500 Index was down 1.5 percent. The JKC Pump Stock Index also decreased 26.7 percent for the same time period.1 The Institute for Supply Management's Purchasing Managers' Index (PMI) fell to 51.1 percent for the month of August compared with 52.7 percent in July. The New Orders Index decreased to 51.7 percent from 56.5 percent, while the Production Index fell 2.4 percentage points to 53.6 percent. Of the 18 manufacturing sectors reporting in the survey, 10 saw growth for the month, including textile mills, paper products and nonmetallic mineral products.
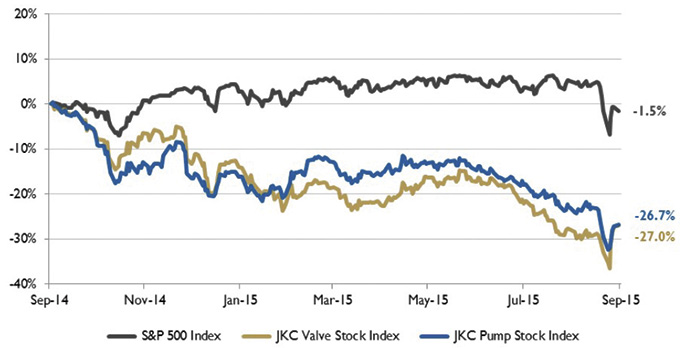 Figure 1. Stock indices from September 1, 2014, to August 31, 2015
Source: Capital IQ and JKC research. Local currency converted to USD using historical spot rates. The JKC Pump and Valve Stock Indices include a select list of publicly traded companies involved in the pump and valve industries weighted by market capitalization.
Figure 1. Stock indices from September 1, 2014, to August 31, 2015
Source: Capital IQ and JKC research. Local currency converted to USD using historical spot rates. The JKC Pump and Valve Stock Indices include a select list of publicly traded companies involved in the pump and valve industries weighted by market capitalization. 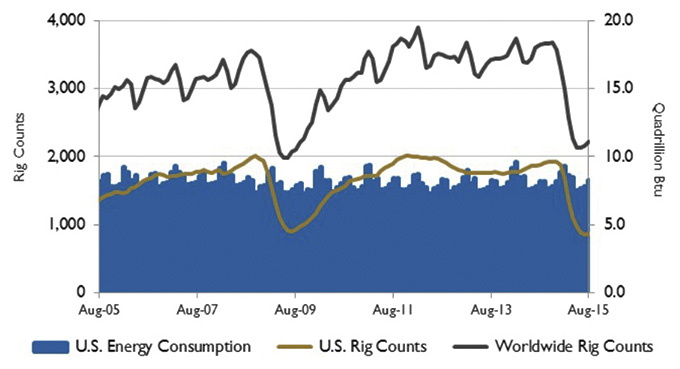 Figure 2. U.S. energy consumption and rig counts
Source: U.S. Energy Information Administration and Baker Hughes Inc.
Figure 2. U.S. energy consumption and rig counts
Source: U.S. Energy Information Administration and Baker Hughes Inc.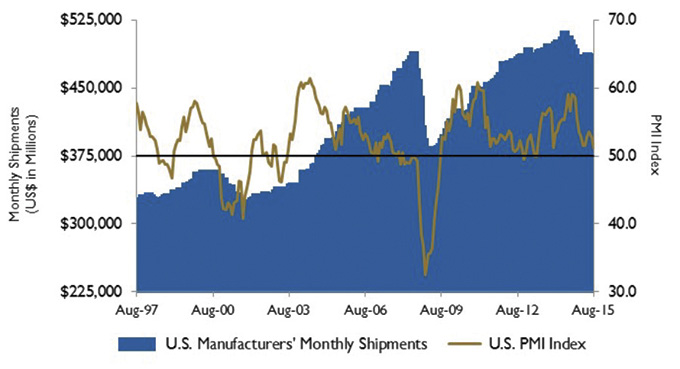 Figure 3. U.S. PMI and manufacturing shipments
Source: Institute for Supply Management Manufacturing Report on Business\'ae and U.S. Census Bureau
Figure 3. U.S. PMI and manufacturing shipments
Source: Institute for Supply Management Manufacturing Report on Business\'ae and U.S. Census Bureau