

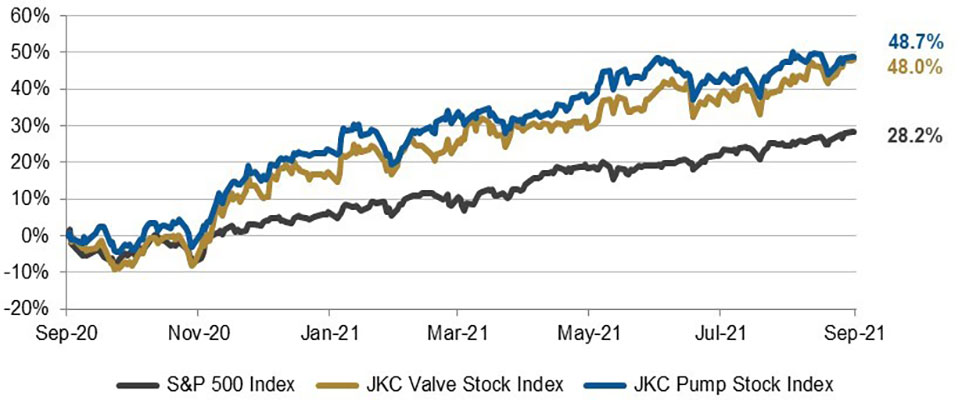
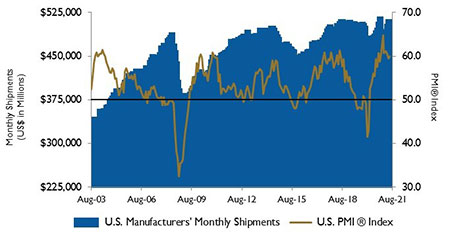
The Jordan, Knauff & Company (JKC) Valve Stock Index was up 48% over the last 12 months, and the broader S&P 500 Index was up 28.2%. The JKC pump stock index rose 48.7% for the same period.1 The Institute for Supply Management’s Purchasing Managers Index (PMI) rose slightly to 59.9% in August.
The Inventories Index registered 54.2%, 5.3 percentage points higher than the July reading, its highest level since 2018. The Price Index fell to 79.4% from 85.7%, the lowest reading since last December. New orders gained 1.8 points to reach 66.7%, indicating manufacturing demand remains quite strong. The Employment Index contracted to 49% versus 52.9%, its lowest reading since last November.
Renewed concerns over COVID-19 took a toll on hiring in August, as employment in the U.S. increased by only 235,000 jobs. July payrolls rose by an upwardly revised 1.05 million.
Manufacturers added 37,000 jobs, most of them coming in motor vehicles despite ongoing struggles to source parts.
Durable goods orders, excluding transportation, rose 0.7%. Orders for vehicles and parts were up 5.8%, while shipments of vehicles and parts rose a slightly larger 5.9%.
Manufacturing continues to grow with orders for fabricated metals adding 0.3%, primary metals orders up 2.7% and orders for machinery up 2.9%. Machinery orders have risen every month since April 2020. Electrical equipment orders fell 1.8% and computers and other electronics products slipped 0.4%
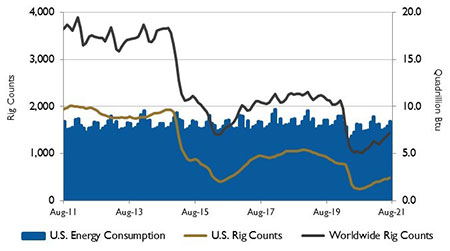
Shale natural gas production in the Appalachian Basin set records in the first half of 2021. The Appalachian Basin spans Pennsylvania, West Virginia and Ohio. Production in the region reached 32.5 billion cubic feet per day (Bcf/d) in December 2020 and averaged 31.9 Bcf/d during the first half of 2021, the highest average for a six-month period since production began in 2008.
The Appalachian Basin contains two shale formations, Marcellus and Utica, which accounted for 34% of all U.S. dry natural gas production in the first half of 2021. Growth in pipeline takeaway capacity allowed natural gas produced in the Appalachian Basin to reach other markets, especially in the Midwest.
From 2008 to 2020, total pipeline takeaway capacity from the Northeast increased from 4.5 Bcf/d to 24.5 Bcf/d, alleviating congestion and supporting higher wholesale natural gas prices in the region.
On Wall Street, the Dow Jones Industrial Average rose 1.2%, the S&P 500 Index grew 2.9% and the NASDAQ Composite rose 4.0% in August. Positive economic data and better-than-expected corporate earnings in the second quarter had a positive effect on the markets.
Despite the COVID-19 delta variant raising concerns about economic recovery, the S&P 500 marked its seventh-straight month of gains and reached just below all-time highs.
1 - The S&P Return figures are provided by Capital IQ.
