

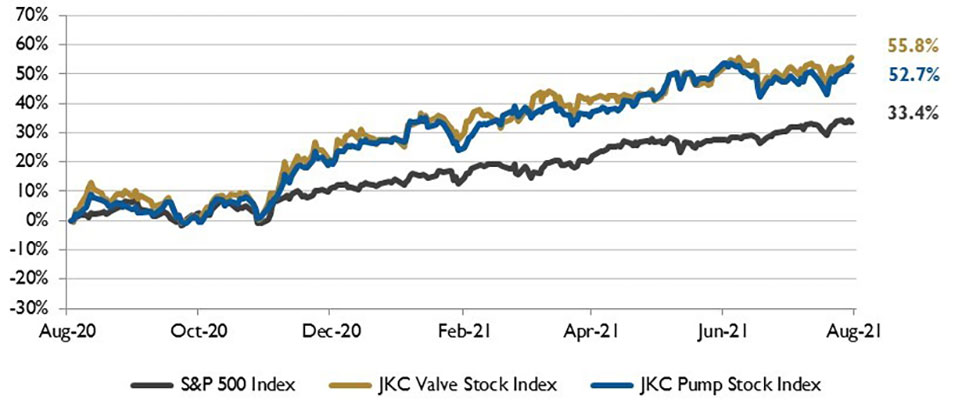
The Jordan, Knauff & Company (JKC) Valve Stock Index was up 55.8% over the last year, and the broader S&P 500 index was up 33.4%. The JKC pump stock index rose 52.7% for the same period.1
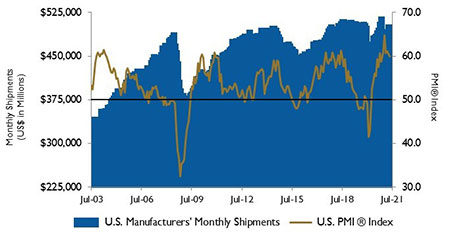
In the first sub-60% reading since January, the Institute for Supply Management’s Purchasing Managers Index (PMI) decreased to 59.9% in July. Prices remain a major concern even though the Prices Index fell to 85.7% from 92.1%, still a high reading.
The Employment Index crossed back into expansion, rising to 52.9% from 49.9% suggesting some easing in labor constraints. Slower growth was seen in new orders with the index slipping 1.1 points, although backlogs remain elevated. The supplier delivery index fell to a five-month low of 72.5%. However, this remains far from “normal” and is the highest reading outside the COVID era in more than four decades.
U.S. gross domestic product (GDP) grew at an annualized rate of 6.5% in the second quarter of the year. Growth was driven by consumer spending, which jumped 11.8%, while every major category of spending posted solid gains. Spending on durable goods rose 9.9%, nondurable goods rose 12.6% and services were up 12%. Growth in business fixed investment spending was robust, with equipment spending going up 13%. Real exports posted a growth rate of 6% but real imports grew even faster, rising 7.8%. Consequently, net exports took 0.4 percentage points away from the topline GDP number.
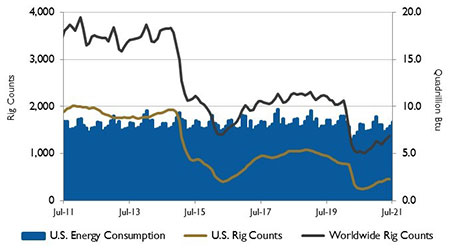
Despite volatility in global oil markets, U.S. crude oil exports hit a record high in 2020 and remain high in 2021. High oil prices have contributed to steady crude oil exports. U.S. crude oil infrastructure has expanded since 2015 to facilitate crude oil exports from onshore production, allowing more oil to be exported from the Permian Basin and Eagle Ford Basin. Most U.S. crude oil exports leave the U.S. from the Gulf Coast region.
U.S. liquefied natural gas (LNG) exports increased in the first half of the year as international natural gas and LNG spot prices increased in Asia and Europe. Averaging 9.6 billion cubic feet per day (Bcf/d), it is an increase of 42% compared with the same period in 2020. Rising global LNG demand, easing COVID restrictions, and continuous unplanned outages at LNG export facilities in several countries also contributed to increased U.S. LNG exports.
On Wall Street, the Dow Jones Industrial Average rose 1.3%, the S&P 500 Index grew 2.3% and the NASDAQ Composite rose 1.2% in July. Growing concerns over the spread of the Delta variant and higher inflation weighed on investor sentiment. Due to higher prices, consumers are showing pessimism over purchasing housing, cars and other household durables.
A key inflation indicator, personal consumption expenditures rose 0.5% in June. Inflation has been rising over the past year and remains at a 13-year high.
Read more market analysis columns here.
Reference
1 - The S&P Return figures are provided by Capital IQ.
