

The Jordan, Knauff & Company (JKC) Valve Stock Index was down 9.5% over the last year, and the broader S&P 500 index was down 5.8%. The JKC pump stock index fell 17.1% for the same time period.1
The Institute for Supply Management’s Purchasing Managers Index (PMI) fell in July from 53.0% to 52.8%, the slowest expansion pace since June 2020.
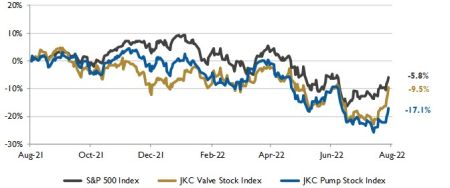
Local currency converted to USD using historical spot rates. The JKC Pump and Valve Stock Indices include a select list of publicly traded companies involved in the pump & valve industries, weighted by market capitalization. Source: Capital IQ and JKC research.
Four of the six largest manufacturing industries—petroleum and coal products, computer and electronic products, transportation equipment and machinery—reported moderate to strong growth. New orders contracted for the second month, dropping to 48.0% from 49.2% in June. The prices paid index slowed to 60.0%, falling 18.5 points.
The inventories index rose to 57.3%, the highest level since 1984. Manufacturers have been adding jobs every month, including 29,000 new factory jobs in June. The employment index remained in contraction territory at 49.9%, an improvement from 47.3% in June.
The U.S. economy contracted in the second quarter, with consumer spending growing at its slowest pace in two years and business spending declining. Gross domestic product (GDP) fell at a 0.9% annualized rate, shrinking 1.3% in the first half of the year.
Consumer spending grew at a 1.0% rate, the slowest pace since the second quarter of 2020. Business spending fell, pulled down by weak investment in equipment and nonresidential structures. Government spending declined for a third straight quarter.
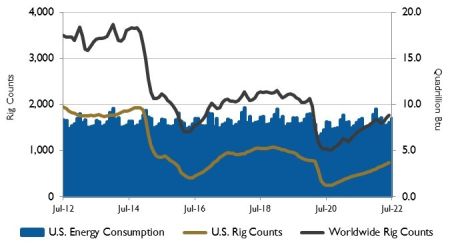
Source: U.S. Energy Information Administration and Baker
Hughes Inc.
Exports grew by 1.4% due to record exports, ending seven straight quarters of trade dragging on growth. The increase in exports reflected increases in both goods (led by industrial supplies and materials) and services (led by travel).
During the last year, the monthly average Henry Hub natural gas spot price rose from $3.84 per million British thermal units (MMBtu) in July 2021 to $7.70/MMBtu in June 2022. The price increased monthly in the first half of 2022 as domestic consumption and exports grew. In July 2021, high demand for natural gas for electricity generation combined with high levels of U.S. natural gas exports led to below average inventory builds.
In the first quarter of 2022, colder than normal temperatures resulted in total natural gas consumption exceeding the five-year average. Growth in Asia and constraints on liquefied natural gas (LNG) exports from Russia to Europe contributed to strong international demand for natural gas, resulting in increased U.S. LNG exports.
The Dow Jones Industrial Average and the S&P 500 Index gained 6.7% and 9.1%, while the Nasdaq Composite rose 12.4% in July, the biggest monthly gains since 2020.
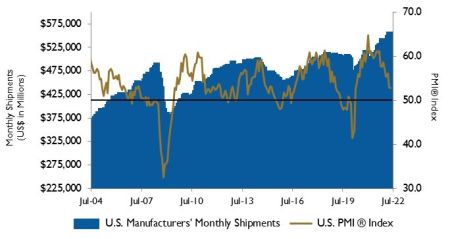
Source: Institute for Supply Management Manufacturing Report
on Business and U.S. Census Bureau
Tech stocks rallied due to strong earnings reports from big companies, while energy stocks rose due to a surge in oil and gas prices. Investors seem less concerned about the aggressive pace of the Federal Reserve’s monetary policy tightening and inflation peaking.
1- The S&P Return figures are provided by Capital IQ.
