

Pump curves fall into several categories and each can be presented in slightly different ways. The primary types are:
- pump family selection chart
- manufacturer’s published curve for a pump size
- submittal pump curve
- certified pump curve
The pump family selection chart gives envelope data for each pump size within a product family. The sizes (flow rates and total head) will range from low to high, and the envelopes for some sizes will have overlap (Image 1). This type of pump curve is useful for developing a short list of pumps that would meet the design point requirement.
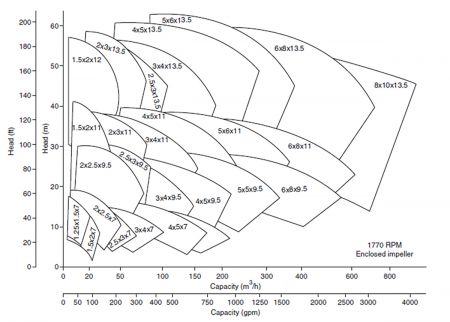
For a pump running at a nominal 1,800 revolutions per minute (rpm) that could develop 30 meters (100 feet) of head at 225 cubic meters per hour (m3/h) (1,000 gallons per minute [gpm]), the 5×6×11 and the 6×8×11 sized pumps overlap on the selection chart (Image 1).
Usually, the three numbers correspond to the pump discharge flange, the pump suction flange and the pump maximum impeller diameter (in inches), respectively.
Once a shortlist of acceptable pumps is developed, the manufacturer’s published curves for the pump size can be examined.
Image 2 shows a 5×6×11 pump running at 1,770 rpm. From the published curve alone, one can determine the efficiency at the rated condition point, the impeller diameter, the power draw from the motor, and the net positive suction head required (NPSHr/NPSH3).
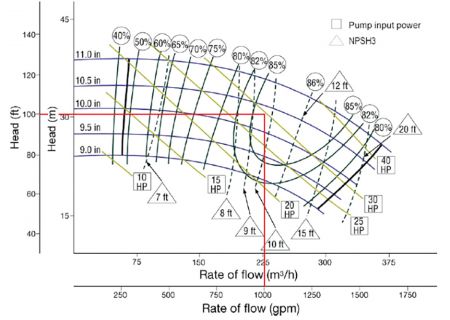
These curves are typically published for pumping water at 20 C (68 F). If a liquid other than water will be pumped, the power information must be adjusted proportionally for the specific gravity, flow and head, and efficiency/power will need to be adjusted per ANSI/HI 9.6.7 if the viscosity is different than water at the standard temperature.
The purchaser can do the upfront work described in Images 1 and 2 to find an appropriate pump for their design point, but often the purchaser will provide their design point to the manufacturer who will provide a submittal curve that meets the requested design point.
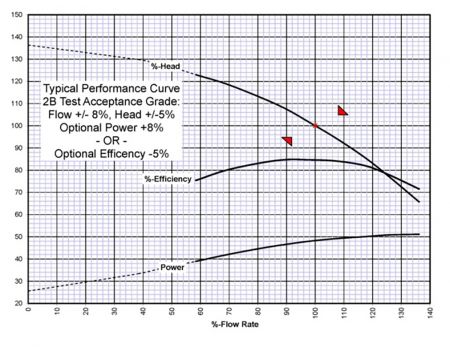
An example of a submittal curve is shown in Image 3. The design point is shown as the red dot. The arrows represent the tolerance band that would be applied for an industry standard grade 2 bilateral tolerance per ANSI/HI 14.6.
Note that there are optional power or efficiency tolerances on this curve for informational purposes that could be specified. If one was required, the manufacturer may adjust the efficiency or power on the submittal curve accordingly.
The last type of curve is the certified performance curve. If specified as a requirement, a certified performance curve is developed and supplied. Unlike the published curve, which may be applied generally for a given type and size of the pump model, the certified curve is developed for the particular pump being supplied under the purchase order.
The test is performed by the manufacturer in accordance with the pump’s specified test standard (such as the latest version of ANSI/HI 11.6 or 14.6). The certified performance curve would look much like the submittal curve, but would include the actual points that were tested and the specifics of the pump it is being supplied for.
For more information on pump curves and power consumption, refer to Hydraulic Institute training resources at www.pumps.org/training.
Read more HI Pump FAQs by clicking here.
