

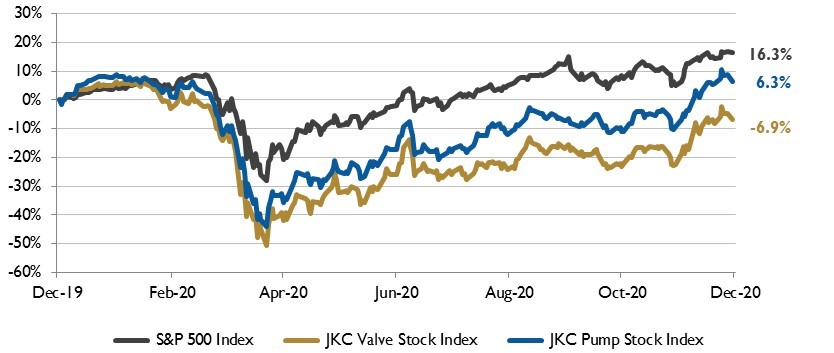
The Jordan Knauff & Company (JKC) Valve Stock Index was down 6.9% over the last 12 months, while the broader S&P 500 Index was up 16.3%. The JKC Pump Stock Index gained 6.3% for the same time period.1
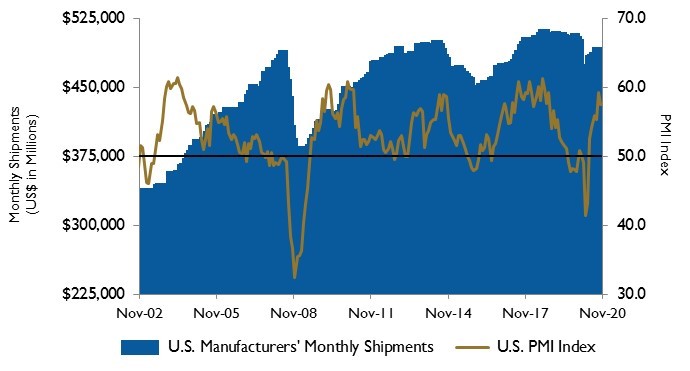
The Institute for Supply Management’s Purchasing Managers’ Index (PMI) registered 57.5% in November, down 1.8 percentage points from the October reading of 59.3%. The New Orders Index registered 65.1%, down 2.8 percentage points from the October reading, and the Production Index was 60.8%, a decrease of 2.2 percentage points from the prior month.
Despite reconfigured factories, absenteeism, short-term shutdowns to sanitize facilities and difficulties in hiring workers, survey respondents were optimistic with 2.5 positive comments for every cautious comment. Of the 18 manufacturing industries surveyed, 16 reported growth. Within the six biggest industries, five (fabricated metal products; chemical products; computer and electronic products; transportation equipment; and food, beverage and tobacco products) registered solid growth in November.
According to the United States Department of Labor, hiring slowed in November with employers adding 245,000 new jobs compared to 610,000 in October. The slowdown can be attributed to the private sector, where jobs increased only 344,000 after rising 877,000 the prior month. Transportation and warehousing was the only major sector to see a major increase in hiring, adding 145,000 jobs. Job growth in the goods sector improved at a slower pace as manufacturing and construction firms posted smaller gains.
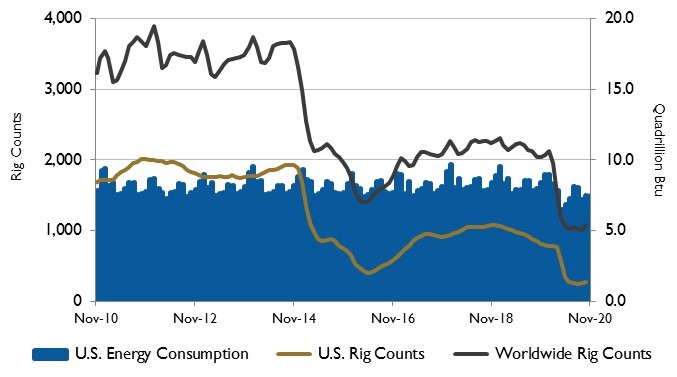
Brent crude oil prices fell in October as previously disrupted production in Libya came back online and as COVID-19 cases increased in many countries. Brent spot prices averaged $40 per barrel in October, down $1 per barrel from the average in September.
The U.S. Energy Information Administration (EIA) expects global oil inventories to continue falling in the coming months. However, EIA expects that Brent prices will remain near $40 per barrel through the end of 2020 due to high global oil inventory levels and surplus crude oil production capacity. The EIA forecasts inventory draws in 2021 will cause some upward oil price pressures and that Brent crude oil prices will average $47 per barrel in 2021.
It was a record-breaking November on Wall Street. The Dow Jones Industrial Average, the S&P 500 Index and the NASDAQ Composite rose 11.8%, 10.8% and 11.8%, respectively. The Dow Jones and S&P 500 had their best November since 1928. The Russell 2000 small cap index climbed 18.3% hitting an all-time monthly high.
Despite surging COVID-19 cases across the U.S. and weak economic data, the market was buoyed by some positive developments on the COVID-19 vaccine.
Reference
1. The S&P Return figures are provided by Capital IQ.
These materials were prepared for informational purposes from sources that are believed to be reliable but which could change without notice. Jordan, Knauff & Company and Pumps & Systems shall not in any way be liable for claims relating to these materials and makes no warranties, express or implied, or representations as to their accuracy or completeness or for errors or omissions contained herein. This information is not intended to be construed as tax, legal or investment advice. These materials do not constitute an offer to buy or sell any financial security or participate in any investment offering or deployment of capital.
