
Previous “Pump System Improvement” columns covered the assessment of simple systems with a single load. The system discussed in this column has multiple loads. Figure 1 is a schematic of a piping system under evaluation. This system in Figure 1 has three circuits. Circuit 1 consists of the tank (GS-TK-000), the pump (GS-PU-001), the heat exchanger (GS-HX-001), the process element (GS-PE-001), the control (GS-FCV-001) and the destination tank (GS-TK-001), along with the interconnecting pipelines. The supply tank (GS-TK-000), the pump (GS-PU-001) and the heat exchanger (GS-HX-001) are common elements to all three circuits. Circuit 2 includes the supply tank, the pump, the heat exchanger, GS-PE-002, GS-FCV-002 and the destination tank (GS-TK-002).
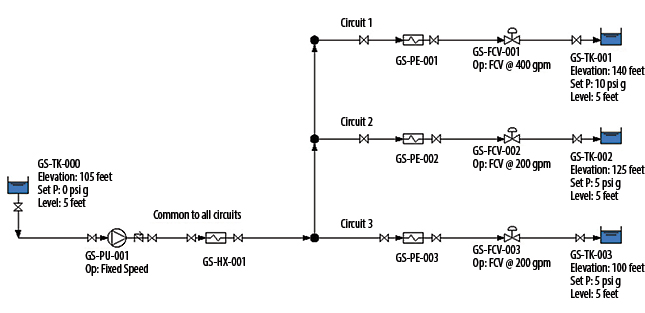 Figure 1. A circuit with multiple loads (Graphics courtesy of the author)
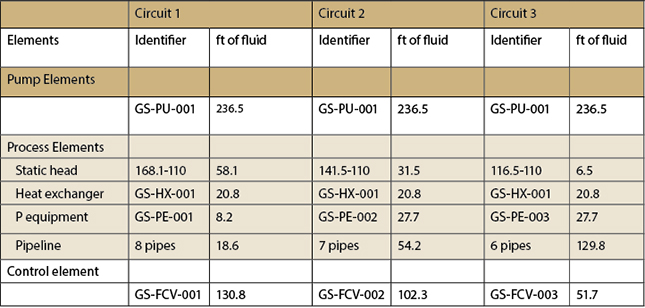 Table 1. The pump head and the head losses for the process and control elements are displayed. In each circuit, the head added by the pump equals the energy used by the process elements and control elements.
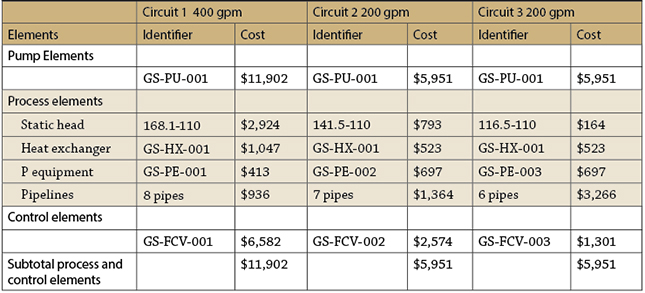 Table 2. The energy cost balance sheet shows the cost to operate each item in the piping system as originally operated.
Expanding the System
The plant needed to modify the system to meet increased process requirements—Circuit 1 needed to supply 450 gpm, and Circuits 2 and 3 each needed to supply 250 gpm. The engineering group determined that the existing pump could have the capacity to meet the additional flow requirements by increasing its impeller diameter from 15.5 inches to 17.5 inches. The energy cost balance sheet for this modification is shown in Table 3.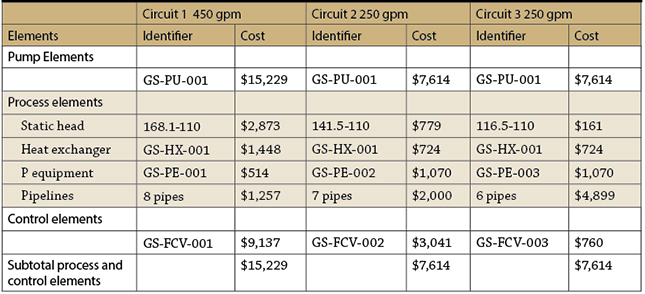 Table 3. The energy cost balance sheet shows the cost to operate each item in the system after increasing the impeller diameter to meet the additional flow and head requirements.
Considering the Cost
Increasing the total system flow rate from 800 to 950 gpm raised the operating cost of the system from $23,801 to $30,454. The annual cost to pump one gallon of water in the original configuration was $29.75. For the increased capacity, the cost is $32.05. Increasing the impeller diameter would not decrease costs. The energy cost balance sheet showed that the annual cost for the piping system in Circuit 3 is much greater than the cost for Circuits 1 and 2. Further investigation revealed that the fluid velocity in Circuit 3 is 13.4 feet per second (ft/sec) when passing 200 gpm and 16.75 ft/sec when passing 250 gpm after the system expansion. The high operating costs for the pipelines in Circuit 3 suggested that other options for increasing the flow rate needed further exploration. In the unmodified system, the fluid velocity in the three pipelines in Circuit 3 was excessive. Increasing the pipe diameter from 2.5 to 4 inches would reduce the fluid velocity to 6.3 ft/sec. After performing a preliminary calculation for the new pipe, the estimated operating cost of the pipelines in Circuit 3 dropped from $4,899 to $1,000 per year. Based on this information and the potential for additional savings, plant personnel decided to increase the pipe diameter in Circuits 2 and 3 from 3- to 4-inch pipe without increasing the impeller diameter. Table 4 is the energy cost balance sheet showing the operating cost after the change.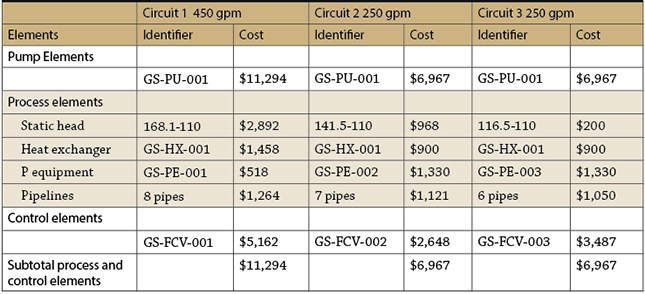 Table 4. The energy cost balance sheet shows the operating cost when the flow rate is increased and the pipe diameters in Circuits 2 and 3 are increased to 4-inch pipe.