Big data methods using a statistical approach can contribute to the optimization of computational fluid dynamics (CFD) analysis by reducing total simulation time in relation to the configuration of pumps and the plants where they are installed.
This article reports the findings of a recent case study conducted using the design of a water intake pumping system. Water intake was chosen for the study because it represents a high added value service (both in terms of reliability and energy consumption) in a wide range of markets such as desalination, power generation, liquefied natural gas (LNG) and common cooling and industrial water supply. It was also selected because the optimization phase of its design requires the study of a large number of configurations and entails complex experimental and CFD testing campaigns.
Introduction to Water Intake Design Studies
The Hydraulic Institute (HI) standards define the guidelines for the design of a reliable water intake, giving the main dimensions of the structure as a function of the inlet diameter of the pump. However, whenever the dimensions of the civil works of a water intake are not in compliance with HI recommendations, a deep investigation of the flow crossing the water intake is necessary to search for any uneven flow distribution near the pump inlet that could cause unexpected vibrations and worsen hydraulic performances. HI standards suggest that the best method to check such configurations is to perform a physical model test study of the water intake based on Froude’s similitude. Nevertheless, physical model testing (with a usual factor of 1:10) is quite expensive and time-consuming as the optimization phase of a water intake requires analysis of many configurations.
CFD Analysis as an Alternative
An alternative to physical model testing is the analysis of a virtual water intake employing CFD. This alternative is beneficial for the evaluation of the characteristics of flow approaching the pumps and for the analysis of different geometric layouts. However, conducting a CFD analysis campaign can be time-consuming based on the computational grid’s complexity and the operative conditions to be simulated. In this circumstance, using big data analysis methodology can complement CFD tools and keep overall simulation time optimal.
To better illustrate this point, see this specific case study of a water intake equipped with eight vertical pumps (two units, each composed of four pumps), which does not comply with HI standards.
Four operative conditions scenarios had to be taken into consideration:
- First scenario: all eight pumps are turned on.
- Second scenario: seven pumps are turned on with one pump in standby mode.
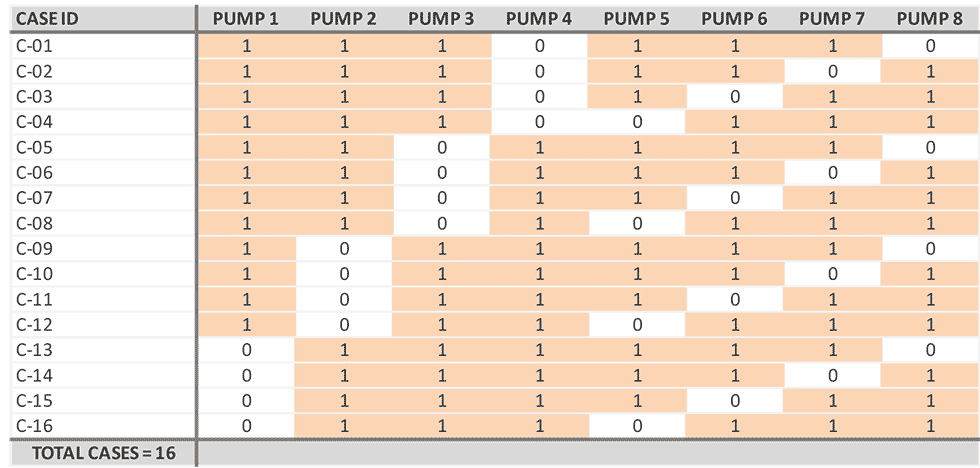
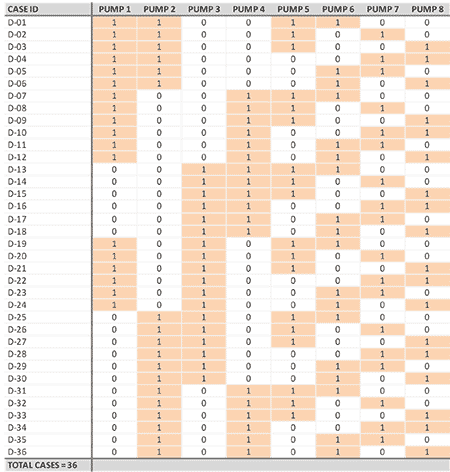
- Third scenario: for each unit, three pumps are operating, and one pump is turned off. Globally, six pumps are operating, and two pumps are in standby mode.
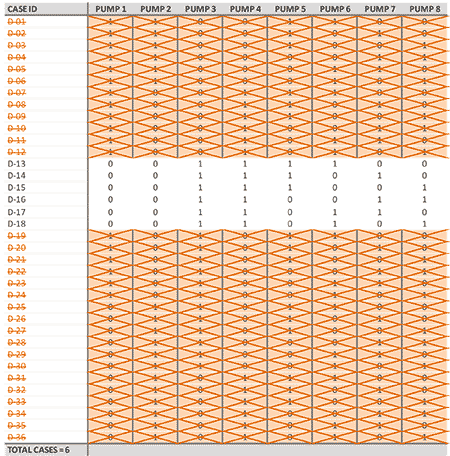
- Fourth scenario: two pumps on each unit are turned off. Globally, four pumps are operating at runout condition, and four pumps are turned off.
The CFD computational grid included the forebay, eight pumping cells and the accurate geometry of the external shape of each pump. For reference, the end user explicitly requested a complete CFD study of the first and second scenarios (nine cases, 76.5 hours of CFD). In addition, a focus was put on studying the third and fourth scenarios for possible CFD time reduction. However, due to the heavy computational grid, the total CFD time requested to complete all the combinations of the third and fourth scenarios would have exceeded 431.5 hours (52 cases), which exceeded a typical job schedule for similar projects (Images 1 and 2).
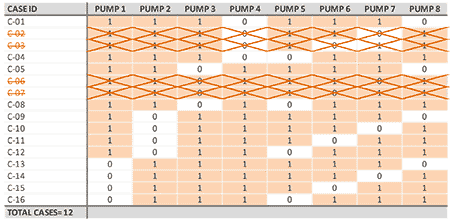
Ultimately, this is why a campaign of CFD analysis was carried out in combination with a quasi-random design of experiments approach for selecting the first set of combinations of pumps turned on and off to be studied. The results of this first campaign were filtered using big data analysis principles, and different input and output variables were selected. Moreover, several objective functions were defined to properly correlate the variables. For example, the criteria used to determine the worst-case were based on the evaluation of the swirl angle generated in the pump inlet, a specific quantity used by HI standards to define the quality of the flow just upstream of the pump bell-mouth. Thanks to the statistical analysis used, the cases with a low tendency to trigger the worst swirl angle were identified and consequently eliminated from the list of possible sequences to be analyzed by CFD for both the third and fourth scenarios, as shown in Images 3 and 4. In the end, the use of big data analysis principles led to a reduction of total computational time by 34.5% (148.5 hours versus 431.5 hours, or 18 cases versus 52 cases).
Pump manufacturers can provide high added value support to end user’s projects from the design phase thanks to the latest generation of research and development tools, including 3D CFD modeling combined with big data methodology. It enables optimal design solutions both in terms of performance and development schedules.