Read Part 1 of this article here.
Electrical signature analysis (ESA) is a specialized method that scrutinizes waveforms to extract insights about the operational state of electromechanical equipment. In a power plant, ESA can be applied to large rotating machinery—such as turbines, generator rotors and auxiliary motors—but it also applies to transformers, breakers and control circuitry.
By comparing the current and voltage waveforms of these components to established baselines, plant personnel can detect subtle abnormalities. For instance, a turbine generator might exhibit unusual current harmonics if there is rotor eccentricity, partial shorting in windings or a developing bearing fault. Similarly, voltage waveforms at the generator terminals can reveal incoming distortions or faults in the interconnected electrical system. ESA turns the generator and associated equipment into self-monitoring devices, where changes in their electrical “signatures” serve as early indicators of potential failures. ESA is the equivalent of vibration analysis but using electrical data instead of having actual vibration sensors on the equipment. A clear advantage of ESA is that the measurement can be achieved at the electrical panel/switchgear instead of having to mount vibration sensors on the actual equipment, which may not be feasible in applications like submersible turbines or pumps.
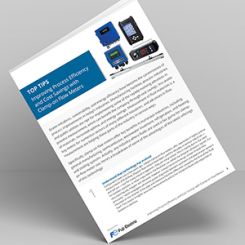
The methodology behind ESA involves comparing present-time waveform data with baseline data obtained during known healthy operating conditions. To understand the health of a pump, for example, a current waveform is captured, and the waveform is transformed to the frequency domain using a fast Fourier transform (FFT). The FFT output is the frequency spectrum and represents all the harmonics that are found in the voltage and current. Image 1 is an example of voltage and current waveforms represented in the frequency spectrum for a low-frequency range of 20-130 Hz.
Assuming the voltage input into the pump is purely sinusoidal at 60 Hz, any harmonic frequencies excluding 60 Hz in the frequency spectrum of the current are a direct consequence of the pump’s operation. In Image 1, the voltage spectrum is very clean while the current spectrum has some harmonics. Every individual harmonic or groups of harmonics can be mapped to specific faults—depending on the rotation or magnetization of the equipment and correlated geometries. For an example of a precisely mapped harmonic, it can be calculated that an impeller with nine blades or vanes will have a blade passing frequency of 9x running speed. If running speed is 1,790 rotations per minute (rpm), then the blade passing frequency will be 16,110 rpm or 268.5 Hz.
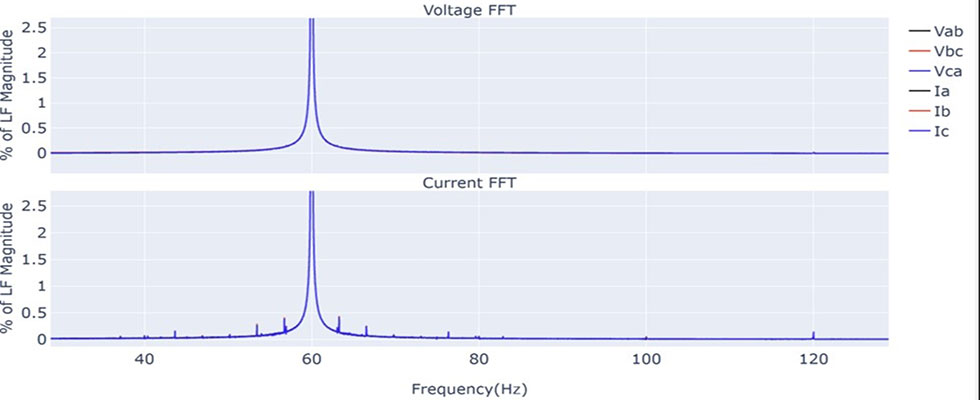
By looking at the frequency spectrum and then tracking individual harmonics over time, like the blade passing frequency, it can be determined if excessive wear is happening on a particular fault condition. In the case of the blade passing frequency at 268.5 Hz, it can be seen if excessive cavitation is occurring and how that may be pitting the vanes over time. Image 2 is an example of an individual harmonic amplitude plotted over a seven-month period. As the harmonic began trending upward over time and began to approach 1% of the line frequency amplitude, maintenance was performed, and the harmonic dropped back to its baseline.
Any deviations from expected baseline spectral patterns indicate incipient faults. With enough baselining and trending over time, precise maintenance practices and prescriptions can be implemented. Continuous waveform monitoring ensures these comparisons happen in real-time, so anomalies can be acted upon immediately.
In the demanding environment of power generation, continuous electrical waveform monitoring has emerged as a potent strategy to reduce downtime, safeguard equipment and ensure compliance with stringent grid codes. By focusing on power quality and employing ESA, plants can identify a wide array of developing faults, from rotor winding issues to transformer insulation problems. The advantages are multifaceted: reduced risk of unplanned outages, extended asset life spans, improved efficiency and a data-driven approach to operational decisions.