

The Story: Accumulated Knowledge Can Prevent Oversizing
In the February 2020 Pumps & Systems column, we discussed the FEED (front end engineering design) process in pump specification and saw how it can lead to oversizing pumps—a practice that can result in equipment not operating efficiently within the system.
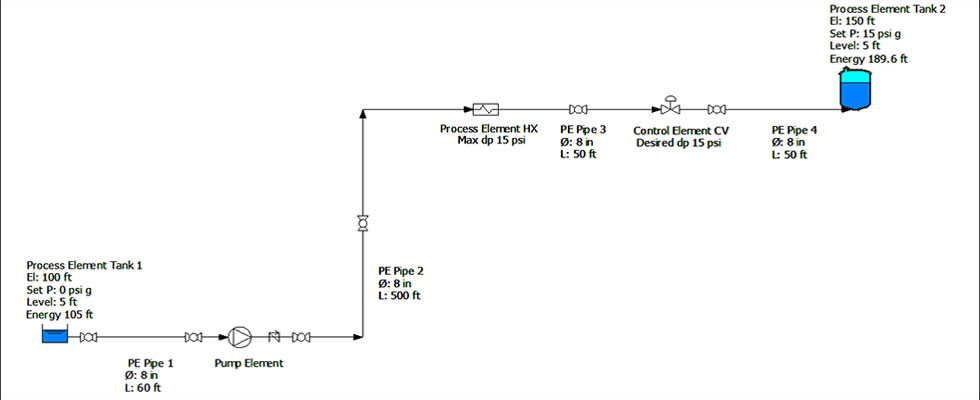 IMAGE 1: Flow diagram showing the locations and elevations of the equipment along with the details needed for pump sizing. (Images courtesy of the author)
We noted that engineers often include a safety factor to account for system unknowns during the FEED process as insurance for the system design. I don’t like the term “safety factor” because all engineering designs should be safe. I prefer the term “design margins” to describe how we account for uncertainties in the preliminary design process.
This month, we’ll follow the FEED process from my last article but use the concept of design margins to document these assumptions and share them with everyone involved in the process. Our objective is to use the team’s collective experience to gain an understanding of how the system will operate, based on the design and operating history of similar piping systems. Our goal is to minimize the number of assumptions that we make during the FEED process and to reduce the magnitude of the design margins to avoid oversizing equipment.
We’ll also conduct a system review to help identify concerns that could occur after the system is placed in operation. Let’s get started, and see how to FEED your pumps right.
The Key: Knowing How the System Will Operate
All piping systems consist of pump elements, process elements and control elements working together to meet each system’s operating requirements. The pump is sized to pass the design flow rate through the process and control elements to make the product or provide the service.
In our example, the operations team at a process company is planning for an upcoming facility expansion. After completing a market study, the team members determine that the system needs a capacity of 600 gallons per minute (gpm) for the foreseeable future. Based on their experiences from similar projects, they realize the system may run at a lower capacity for the first year or two. But, the company is confident in its product and wants to design the system with the flexibility to boost its capacity in the future—if that could be done at a reasonable cost.
They engage the services of an engineering firm and define the system’s capacity requirements of 600 gpm and document their experiences in initially operating the system at a much lower flow rate for up to two years. They set the goal of expanding production capacity to 1,200 gpm to meet potential market demand.
The design firm comes up with two options for consideration. Option 1 consists of sizing the system to meet current conditions, along with the proposed future design capacity of 1,200 gpm. Option 2 consists of sizing the system for the current requirement of 600 gpm, with the ability to add a second 600 gpm parallel stream in the future. Initially, Option 2 is believed to be the less-costly alternative.
After further evaluation, however, it is discovered that the cost for a heat exchanger sized for 1,200 gpm is less than the cost of two heat exchangers sized for 600 gpm. Furthermore, the cost of a single pump for 1,200 gpm costs less than two pumps sized for 600 gpm. This information makes Option 1 look more favorable.
The company’s operational procedures require installation of a standby pump to prevent any process system from shutting down after the failure of a single pump. This mandates the purchase of a standby device for both options. Initially, when operating at the expected 600 gpm flow rate, the cost for the standby pump favors Option 2. Yet, upon considering the proposed future capacity, the cost of two larger pumps for Option 1 is similar to the cost of three smaller pumps required by Option 2.
Based on these and other considerations, the company decides to proceed with Option 1. And, since the expected flow rate through the system varies greatly, a variable frequency drive (VFD) is incorporated to help the pump better meet system requirements. This results in the same flow sheet presented in the February 2020 Pumps & Systems, but now everyone has a clearer idea of how the system will operate over its proposed life.
Design Margins vs. Safety Factors
During the FEED process, we want to use the collective experiences of the engineering team to understand how the system will operate based on the design and operating histories of similar systems. This should minimize the number of assumptions made during the process. To demonstrate, Image 2 compares the pump sizing calculations using the safety factor method (presented in my February 2020 Pumps & Systems article) and the design margin method.
The engineering team creates a set of informed assumptions for the system’s process and control elements based on the sizing criteria. For example:
Static head:
Under normal operations, Tank 1 has a level of 5 feet, and Tank 2 has a normal level of 5 feet and a tank pressure of 15 pounds per square inch (psi). This results in a calculated static head of 84.6 feet (the same as the past article) using a safety factor (Image 2).
During plant operations, variations in tank levels and pressures must be accounted for in the design. Tank 1 is open to the atmosphere and can operate at a low tank level of 1 foot, resulting in a minimum tank energy value of 101 feet. Tank 2 is a closed tank and has a maximum operating pressure of 20 psi and a maximum operating level of 9 feet, resulting in a maximum tank energy of 206.2 feet of fluid. The resulting maximum possible static head is 105.2 feet of fluid. The system may operate like this for less than 5 percent of the time, but the pump must be sized to meet this extreme requirement.
Pipeline head loss:
We’ll start our design by using an as-built pipe list from a previously completed project of similar design. We have realistic estimates for pipe length, along with the count of isolation and check valves, tank penetrations and elbows needed for the head loss calculations. Because the FEED stage occurs before the actual pipe routing, we need to assign design margins for the unknown values associated with pipe length and elbow count.
The pipe specification document provides design margin guidance when calculating the pump’s design point head. The as-built estimate for pipe length is increased by 20 percent, and the number of elbows is doubled when performing pump sizing head loss calculations. This results in a pipeline head loss of 51.4 feet.
Process element heat exchanger (HX):
The firm’s HX specification states that the maximum allowable differential pressure shall be no greater than 15 pounds per square inch differential (psid) at the design flow rate. A design margin of 5 psid pressure is added to account for heat exchange tube fouling. This results in a heat exchange head loss for pump sizing of 46 feet of fluid. Under normal operation, the HX head loss will be less than this value, but the value is used for selection calculations.
Control element valve (CV):
The CV specification states all valves should be sized with a differential pressure of 15 psi with the valve in the 80 percent open position at the design flow rate. NOTE: The operating company decided to leave the CV as a backup, in the event the VFD would not be able to maintain the flow rate over the range of operations.
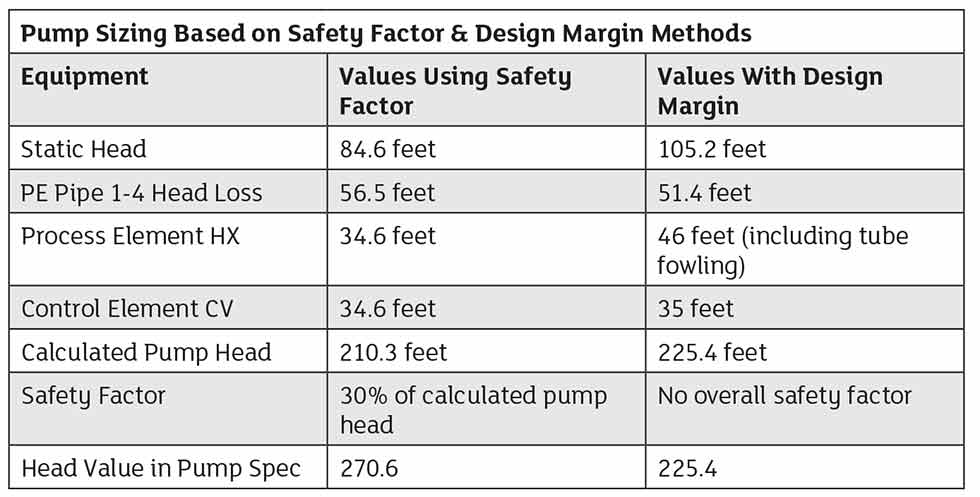
Image 2 compares the safety factor and design margin methods when arriving at a pump selection design point. In both methods, the pump head equals the sum of the calculated head loss for the process and control elements at the design flow rate.
Remember, in the safety factor method, each reviewer adds their own based on work experience in their expertise. It’s difficult to determine the total safety factor, but last month, we proposed a 30 percent factor.
Using the design margin approach, the number of design variables have been reduced by:
- a better understanding of the system flow rates during the system’s lifetime
- calculating the maximum static head based on expected plant operations
- using as-built data from previous system designs to arrive at starting estimates for pipe length and routing
- identifying the uncertainties in pipe length and number of elbows; factoring in a documented design margin
- specifying a realistic value for HX fouling based on plant history
- factoring in the pressure drop across a CV at the design flow rate
The design margin values are specified in each step of the sizing calculations. When questions arise, knowing the design margins and how they’re determined gives everyone a clear view of the process.
Based on the results of the FEED calculations, the engineering firm provides a pump specification with a design point of 1,200 gpm and 226 feet of head.
Pump Selection Process
The pump specification, complete with the design point and the requirement for a VFD, is sent to each supplier on the pump bidders’ list.
Because the pump design point is the maximum value expected for the system, many suppliers now recommended a pump with the best efficiency point (BEP) flow closer to 1,200 gpm. The suppliers still increase the impeller diameter to take better advantage of the selected motor size. Some habits are hard to break. With the use of a VFD as the control element, the flow rate through the system can be adjusted by changing the pump’s impeller speed to meet actual system requirements.
The successful pump supplier recommended a 6 x 5-16 end suction pump with a 15 1/8-inch diameter impeller operating at 1,750 revolutions per minute (rpm) consuming 88 horsepower (hp). The pump’s BEP of 75 percent occurs at 1,000 gpm, and the pump is supplied with a 125-hp motor with a VFD.
The engineering firm reviews the pump recommendations, accepts the bid and creates a purchase order. The supplier accepts the purchase order, sends the document package to the design team and then sends the pump to the job site.
Placing the System Into Operation
Once the system is complete and turned over to operations, the current market only requires 400 gpm. A system energy balance is developed using the manufacturer’s supplied pump curve and HX pressure drop data. Energy balances are performed at the current operation of 400 gpm, the expected operation of 600 gpm and the future design operation of 1,200 gpm.
The system was controlling successfully using the VFD. Remember, the CV was only included as a backup if the VFD failed. The head loss across the fully open CV is factored as a control loss and could be thought of as backup for the VFD.
The pipeline head loss was calculated based on the installed piping and the actual static head calculated by the normal operating difference between the tanks. The HX values were based on the manufacturer’s supplied data without fouling.
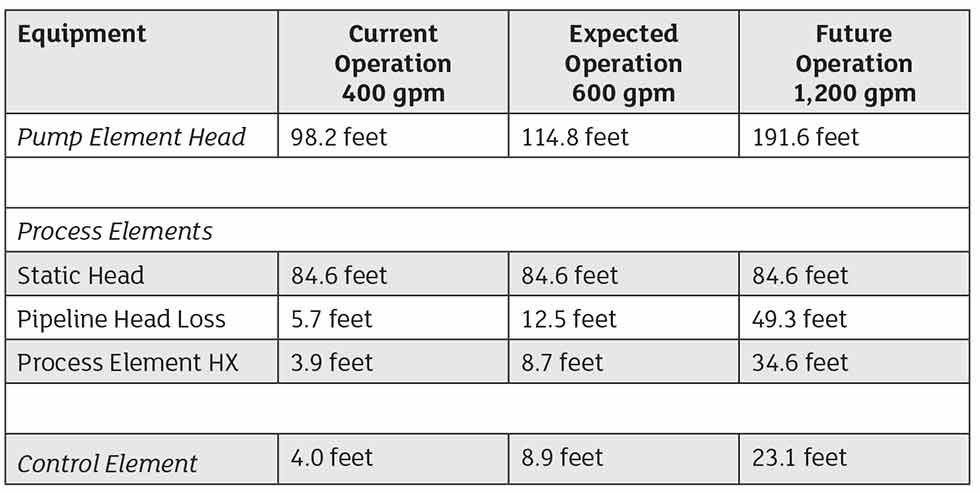
Image 3 shows the energy used in the system. Notice that the energy consumed in the process elements and control elements equals the energy supplied by the pump. By using a variable speed drive (VSD) on the pump element, the pump speed only provides the actual energy required by the process and control elements.
In looking at Image 4, please note that a change in the pump speed directly affects the BEP, along with the percent of BEP flow. Also notice that the pump power has a dramatic decrease at the lower flow rates. This is attributed to the fact that, at lower flow rates, the head loss in the process element decreases, which allows the pump to operate at a lower speed.
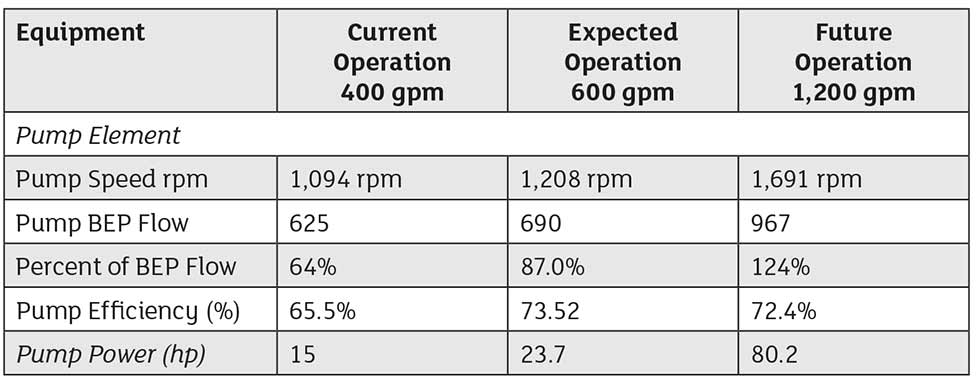
The “Rotodynamic Pump Guidelines for Operating Regions (ANSI/HI 9.6.3)” standard recommends operating the pump with the flow rate between 80 percent to 110 percent of the BEP flow. The pump with the VFD has the percent of BEP flow closer to the actual flow rate through the pump, and the pump operating around 600 gpm is in the middle.
Oversizing Pumps Can be Avoided
In the series of articles about the FEED process for pump selection, the design flow rate and total developed head requirements are key values for specification. These calculations must be completed before many system details are available. This results in assumptions on the final design.
This month, we covered the design margin method. We saw how team members used their experiences in developing a long-term project plan. By providing this plan, each can incorporate flexibility in its initial design, while including methods to minimize future expenses.
We also discussed using previous projects of similar design as the starting point for the process. Design margins were spelled out and used to identify what could vary during the intermediate and final design. With these steps, we reduced the probability of oversizing equipment.
To read more Pump System Improvement columns, click here.
