

Sometimes engineers can be both safe and sorry.
Creating specifications for a pump system usually takes a long time, and pump selection has a major impact on subsequent design calculations. Specification development happens early in the design process, and it requires engineers to make many assumptions that drive sizing calculations and pump specs.
In engineering, it is often said that good design is based on experience, and you gain experience by making mistakes. But no one wants to make a mistake when sizing a pump for a process system, so there’s a tendency—“for safety’s sake”—for the pump’s specs to exceed what is needed.
Oversizing pumps is insurance for early stage design uncertainties. It is natural to factor in life’s uncertainties; that’s why we purchase insurance. I’d never recommend going without insurance, but I don’t want to pay for more coverage than I need. So, in pump selection, we must respect the need for insurance but be realistic about our assumptions and document the results.
Another thing about engineers is that we like to come up with acronyms to describe existing processes. Back in the day, the first step in any design was called preliminary engineering. Now it is called FEED, for front-end engineering design.
My column this month discusses the FEED process for pump selection, how it can lead to oversizing pumps and how these plus-sized pumps impact system operations. In a future article, we will cover how to obtain a realistic view of pump requirements and suggest ways to reduce the costs of oversized pumps.
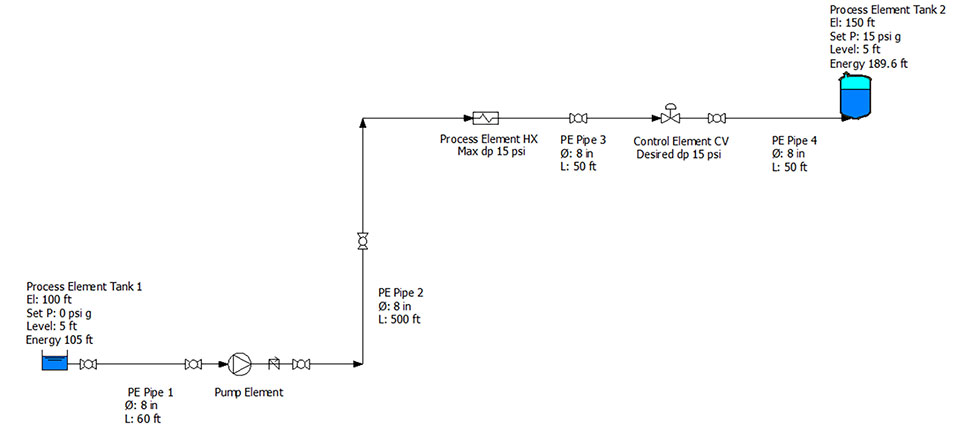 IMAGE 1: Flow diagram showing the location and elevations of all the equipment along with the details needed for pump sizing. (Images courtesy of the author)
The Pump FEED Process
All piping systems consist of pump elements, process elements and control elements, all working together to meet the intended system design. The pump element is sized to pass the design flow rate through the process and control elements to make the product or provide the service.
In the example I’m about to describe, a manufacturing company needs to expand its plant to add a new product to its line. After completing a market study, it estimates that it requires a system capacity of 600 gallons per minute (gpm) for the foreseeable future. Because of the facility’s long life expectancy and, seeking to leverage the expense of a new system, the company decides to double its designed capacity to 1,200 gpm. It selects an engineering firm for system design, specifies this desired output and provides the process requirements.
Then the FEED process begins. The first step is estimating the locations and elevations of the system equipment within the facility. The engineering firm estimates design requirements for the process and control elements based on the firm’s sizing criteria. For example:
Static head: The mechanical department uses the estimated equipment elevations from the civil engineering group and the design values of tank levels and pressures from the process group to arrive at the energy at Tank 1 of 105.6 feet, and at Tank 2 of 189.6 feet. The system static head is the change in energy between Tank 2 and Tank 1, or 84.6 feet.
Pipeline head loss: The pipe diameters are sized based on the firm’s piping specification, based on an average fluid velocity, which is based on process fluids and pipe material. The pipeline head loss is calculated using the pipe diameter, the estimated pipe lengths, and valve and fitting counts.
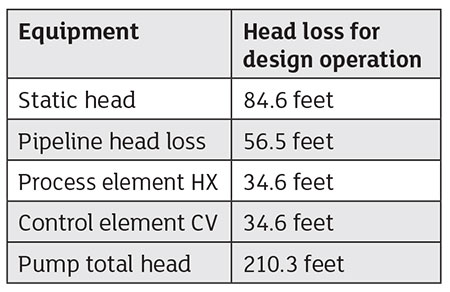 IMAGE 2: The method of determining the pump total head sizing requirements during the FEED process
Process element heat exchanger (HX): The firm’s HX specification states the maximum allowable differential pressure shall be no greater than 15 pounds per square inch (psid) at the design flow rate. This results in a head loss of 34.6 feet.
Control element control valve (CV): The CV specification states all valves should be sized with a differential pressure of 15 psi with the valve in the 80 percent open position at the design flow rate.
Image 2 summarizes the system losses needed for calculating the pump’s total developed head. It equals the sum of the calculated head losses for the process and control elements at the design flow rate. The minimal pump head requirement of 210.4 feet of fluid is needed at the design flow rate of 1,200 gpm.
Introducing the ‘Safety Factors’
At this point, for the sake of insurance, the firm adjusts head loss estimates upward to account for unforeseen conditions. These are “safety factors” that, in this example, may reflect uncertainties associated with estimated pipe length, the count of valves and fittings, losses associated with heat exchanger fouling, control valve operation, variations in tank levels and pressures, and any other concerns expressed by members of the review team.
Often, Engineer A may add a safety factor to the calculated value before passing the spec on to the next person, Engineer B, who is involved in the review process. Engineer B may add his or her own safety factor, and so on, until the team has reviewed and recommended a final design. In this example, after completing the review, the resulting pump total head requirement of 274 feet of head at 1,200 gpm was used.
The Pump Supplier
The engineering firm completes the pump specification using the design point of 1,200 gpm and 275 feet of head and sends it to the pump suppliers.
The winning supplier recommends an 8 x 6-20 end suction process pump operating at 1,750 rpm. The selected pump needs a 16.5-inch diameter impeller with a pump efficiency of 70 percent, requiring 119 horsepower (hp).
The pump’s best efficiency point (BEP) of 73.4 percent occurs at a flow rate of 1,550 gpm. The pump is selected because the design flow was left of the BEP, so as the system capacity increases, the pump’s efficiency would improve.
The person selecting the pump increases the impeller diameter to 17 inches to take advantage of the 200-hp motor supplied with the pump. This results in a pump head of 296 feet of fluid at the design flow rate of 1,200 gpm, shown on Image 3.
The selected pump is purchased, and the pump details are used in various stages of the engineering process. The pump is shipped and installed.
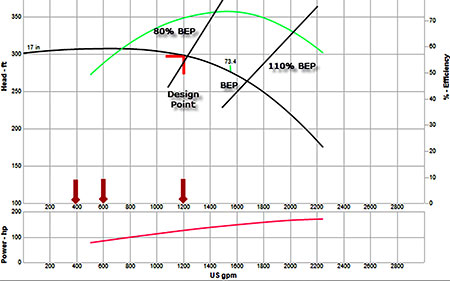 IMAGE 3: Pump curve for the recommended pump, along with the BEP, and the recommended range of 80 percent to 110 percent of BEP flow.
The Pump in an Operating Environment
After the system is commissioned and turned over to operations, the current usage only requires a capacity of 400 gpm. The operations group wants to know the effects of operating the system at this lower capacity.
A system energy balance is developed using the displayed pump curve and heat exchanger operational data supplied by the manufacturers.
The pipeline head loss is based on the installed piping, and the static head is calculated by the energy difference between the tanks. The control element is determined by subtracting the energy of the process elements from the pump elements (see Image 4).
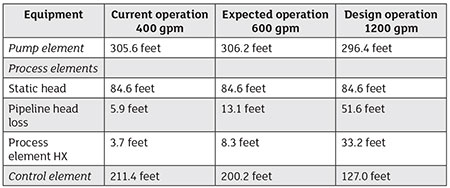 IMAGE 4: The system energy balance showing how the energy is used within the system.
The system energy balance shows how the energy provided by the pump elements equals the sum of the energy consumed by the process and control elements of the system.
Using the results of the energy balance, the operations group compares how the system equipment is performing to industry norms. Image 5 shows key equipment information under the actual operations of 400 gpm, the expected operations of 600 gpm, andthe design operations of 1,200 gpm based on future conditions. Looking at the supplied pump curve, notice the BEP is 80 percent at 1,550 gpm. The “Rotodynamic Pumps’ Guideline for Operating Regions (ANSI/HI 9.6.3)” standard recommends operating the pump at a flow rate between 80 percent to 110 percent of the BEP flow rate as shown on the pump curve.
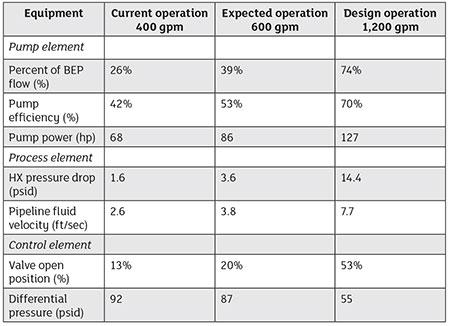 IMAGE 5: Comparing the operation of the system elements to industry guidelines.
The ratio of the actual pump flow to the pump’s BEP flow results in the percentage of BEP flow.
We can see the selected pump will not operate within the recommended range at any time during pump’s operation. This will have a major impact on the pump’s operation and the system’s reliability for the foreseeable future.
The differential pressure across the heat exchanger is much lower than the maximum value stated in the specification for the expected operation. This lower pressure drop across the heat exchanger reduces pumping requirements but comes at a greater capital cost.
Fluid velocity within a pipe has a major effect on head loss. Common industry practice recommends a pipe’s fluid velocity between 4 to 10 feet per second. We can see the fluid velocity for expected operations is outside this range. The lower pipeline head loss reduces pumping requirements but, again, comes at a greater capital cost.
In looking at the control valve, notice the valve positions range between 13 percent to 53 percent open with a resulting differential pressure from 92 psid to 55 psid.
The fact that the control valve position is 20 percent or less at flow less than 600 gpm can cause major operational problems. Notice the differential pressure at the design condition is much greater than the 15 psi differential pressure stated in the control valve specification. The higher differential pressure does not improve the valve operation.
Conclusion
In the process we’ve described for selecting pumps in piping systems, each step was based on sound engineering principles. The use of “safety factors” reflects the team members’ experiences when dealing with system unknowns early in the design process.
But, as we saw in this example, when the piping system was placed in operation, both the pump and process elements were oversized. This, in turn, resulted in a differential pressure across the control valve that is much greater than expected. These factors, in my judgment, increased the system’s capital costs, operational costs and maintenance costs.
In my next Pumps & Systems column, I will explain ways to improve the pump selection process, while still maintaining operational flexibility to efficiently run the system through its lifetime.
To read more Pump System Improvement columns, click here.
