Overview
Deal Activity
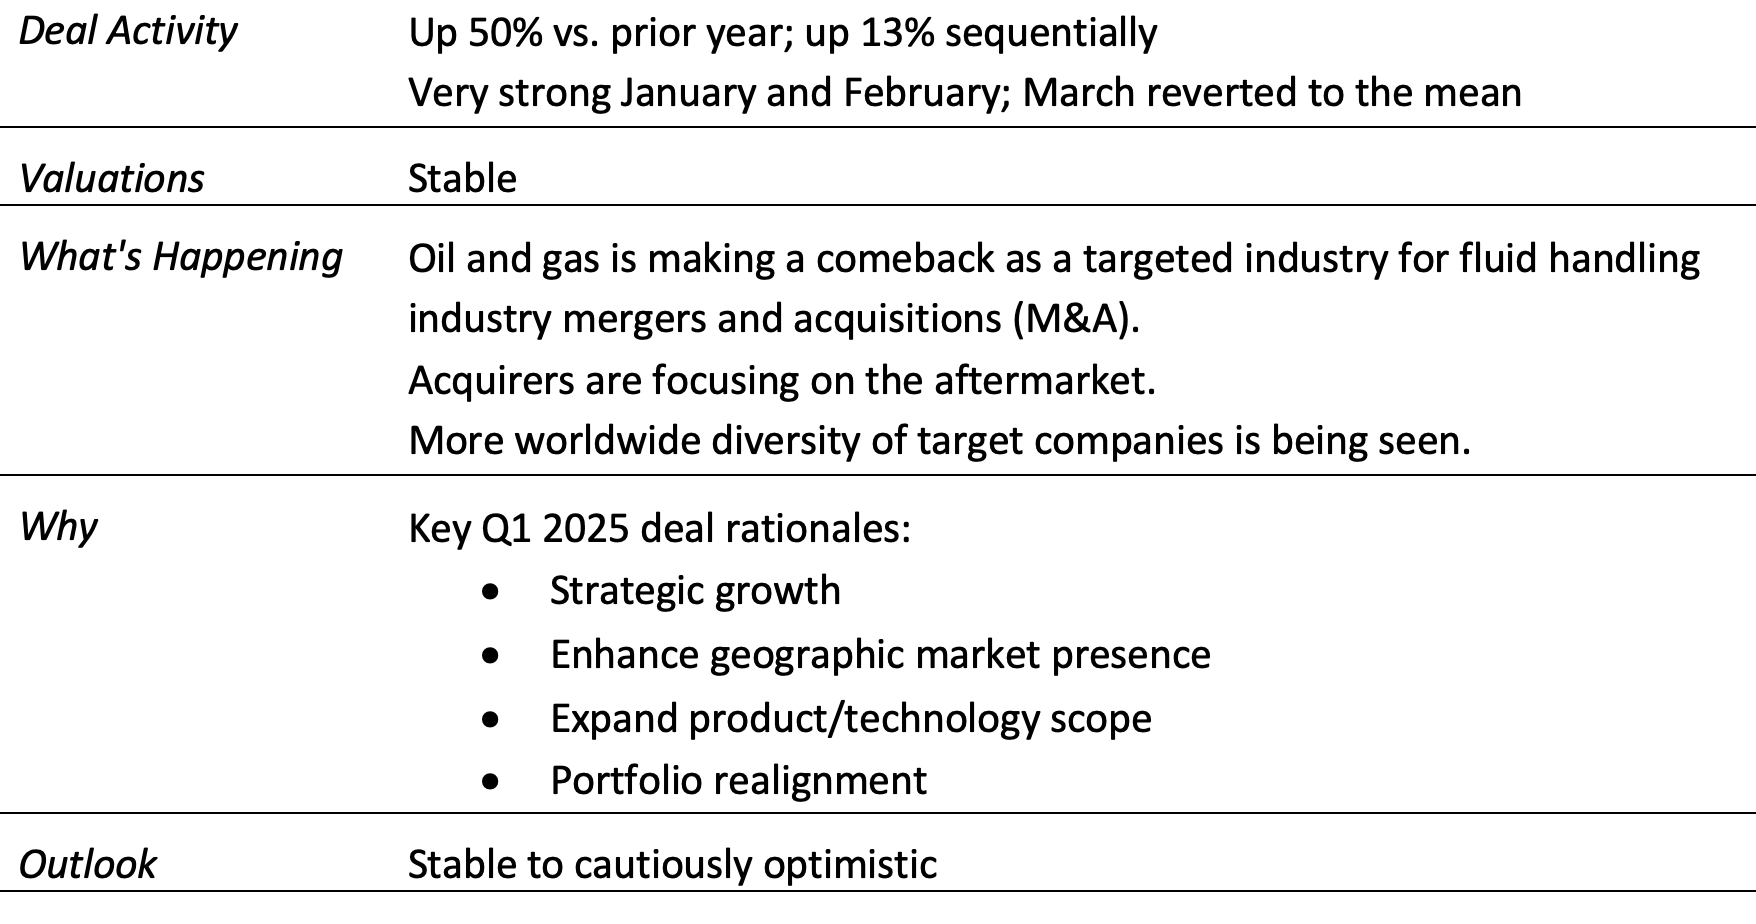
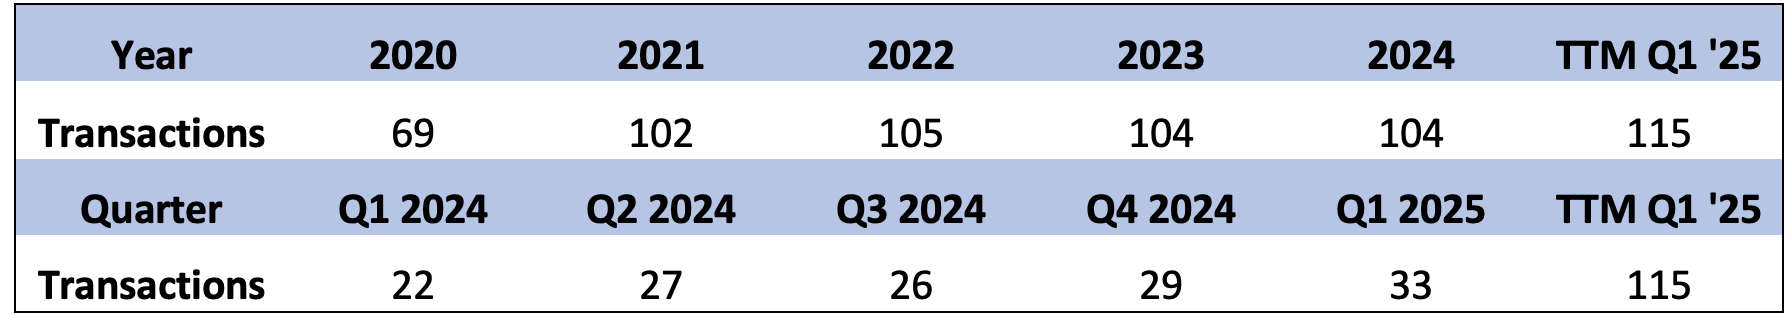
Deal activity in the first quarter of 2025 (Q1 2025) was very strong—the strongest Q1 since the record-setting year in 2021. The activity in January was exceptionally strong with the expectation that an improved business environment starting in 2025 would carry over into a continuation of the strong M&A activity experienced over the prior three years, with the potential for even stronger activity.
However, as the quarter progressed, cautiousness set in with discussion of tariffs, rekindling of inflation and possible recession. With that cautiousness, activity reverted to normalized levels in February and March.
Valuations
The fluid handling industry disclosed that deal valuation data points were limited in Q1. However, as shown below, data published for overall transactions shows valuations are holding up.
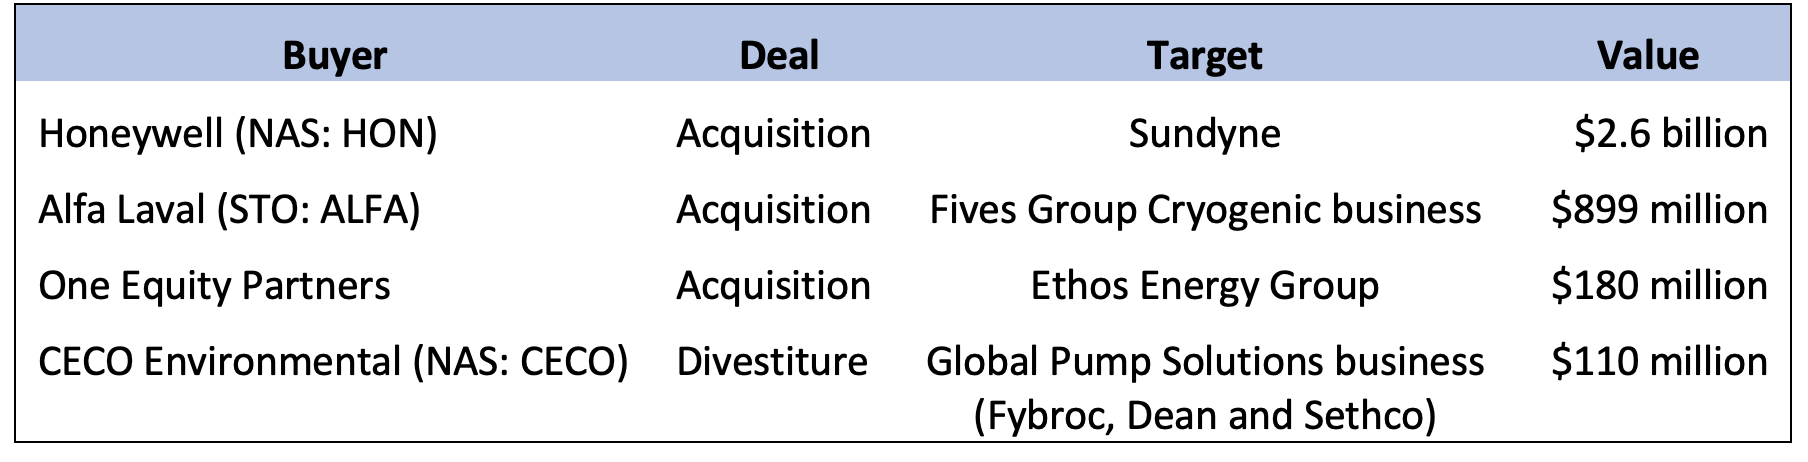
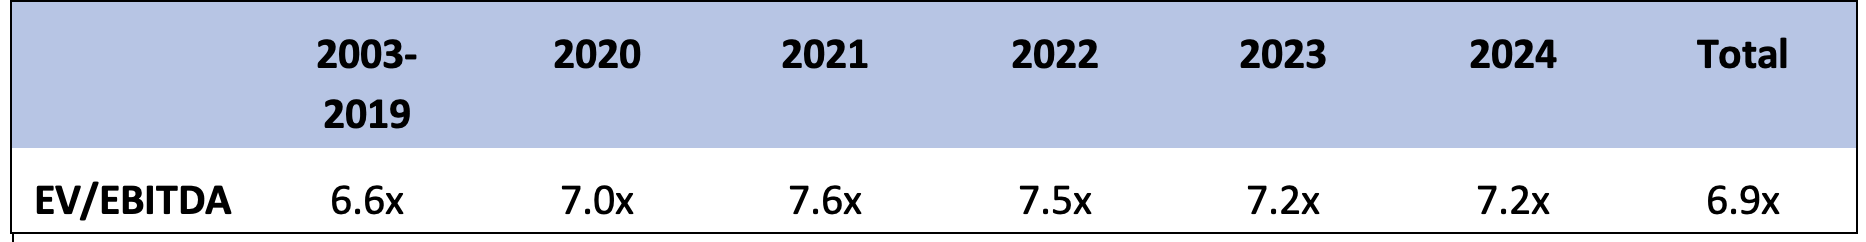
The fluid handling industry disclosed transaction values in Q1 2025 are as follows:
The below valuations are median values for transactions of all sizes and all industries in North America and Europe. The number of transactions in the sample size range from 715 to 1,567 for enterprise value (EV)/earnings before interest, taxes, depreciation and amortization (EBITDA) values and from 1,463 to 3,125 for EV/Revenue values in any given year depending on the deal activity.
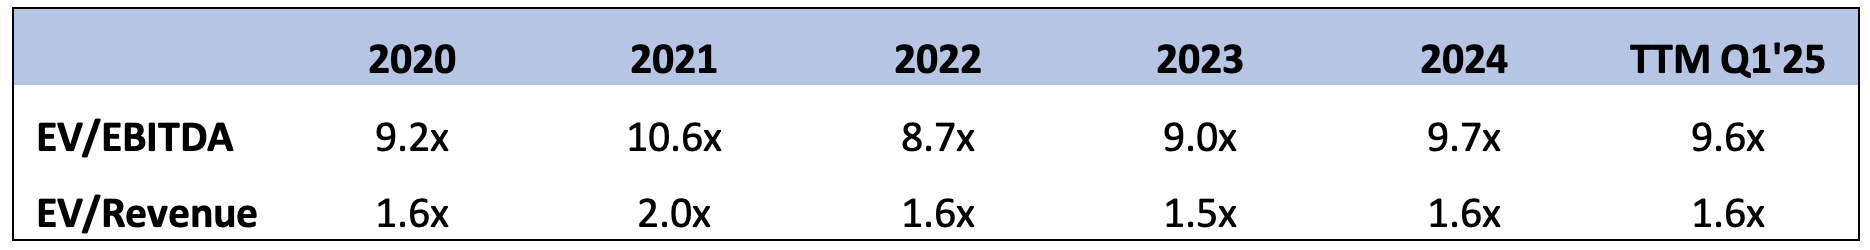
Below are valuations based on reported private equity transactions in the EV range of $10 to $500 million and EV/EBITDA multiples in the range of 3x to 18x trailing twelve months (TTM) EBITDA.
These are generalized valuations to show overall trends. The value of any specific business is dependent on a number of factors including size, growth history and outlook, profitability, strategic fit and risk factors (external macro risk, market risk and execution risk).
What's Happening?
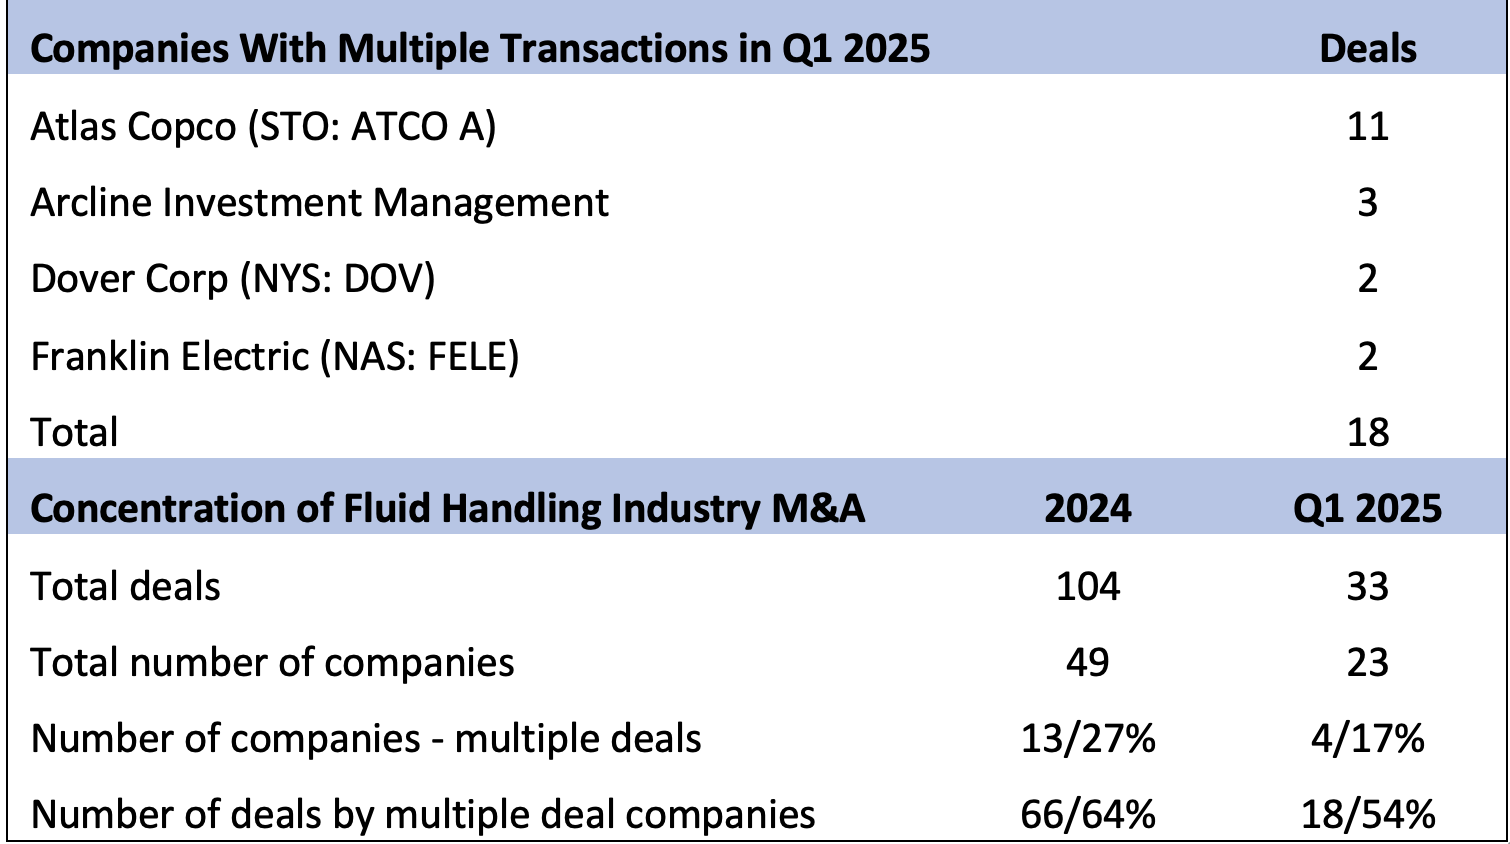
The below profile of deal activity shows that while there was a wider spread of activity in Q1 2025 vs. all of 2024, there remains a significant level of deal activity concentration in the industry. In Q1, four companies accounted for over half (54%) of the transaction activity in the quarter.
The below table shows information on Q1 2025 deal targets by industry, type of business and geographic regions.
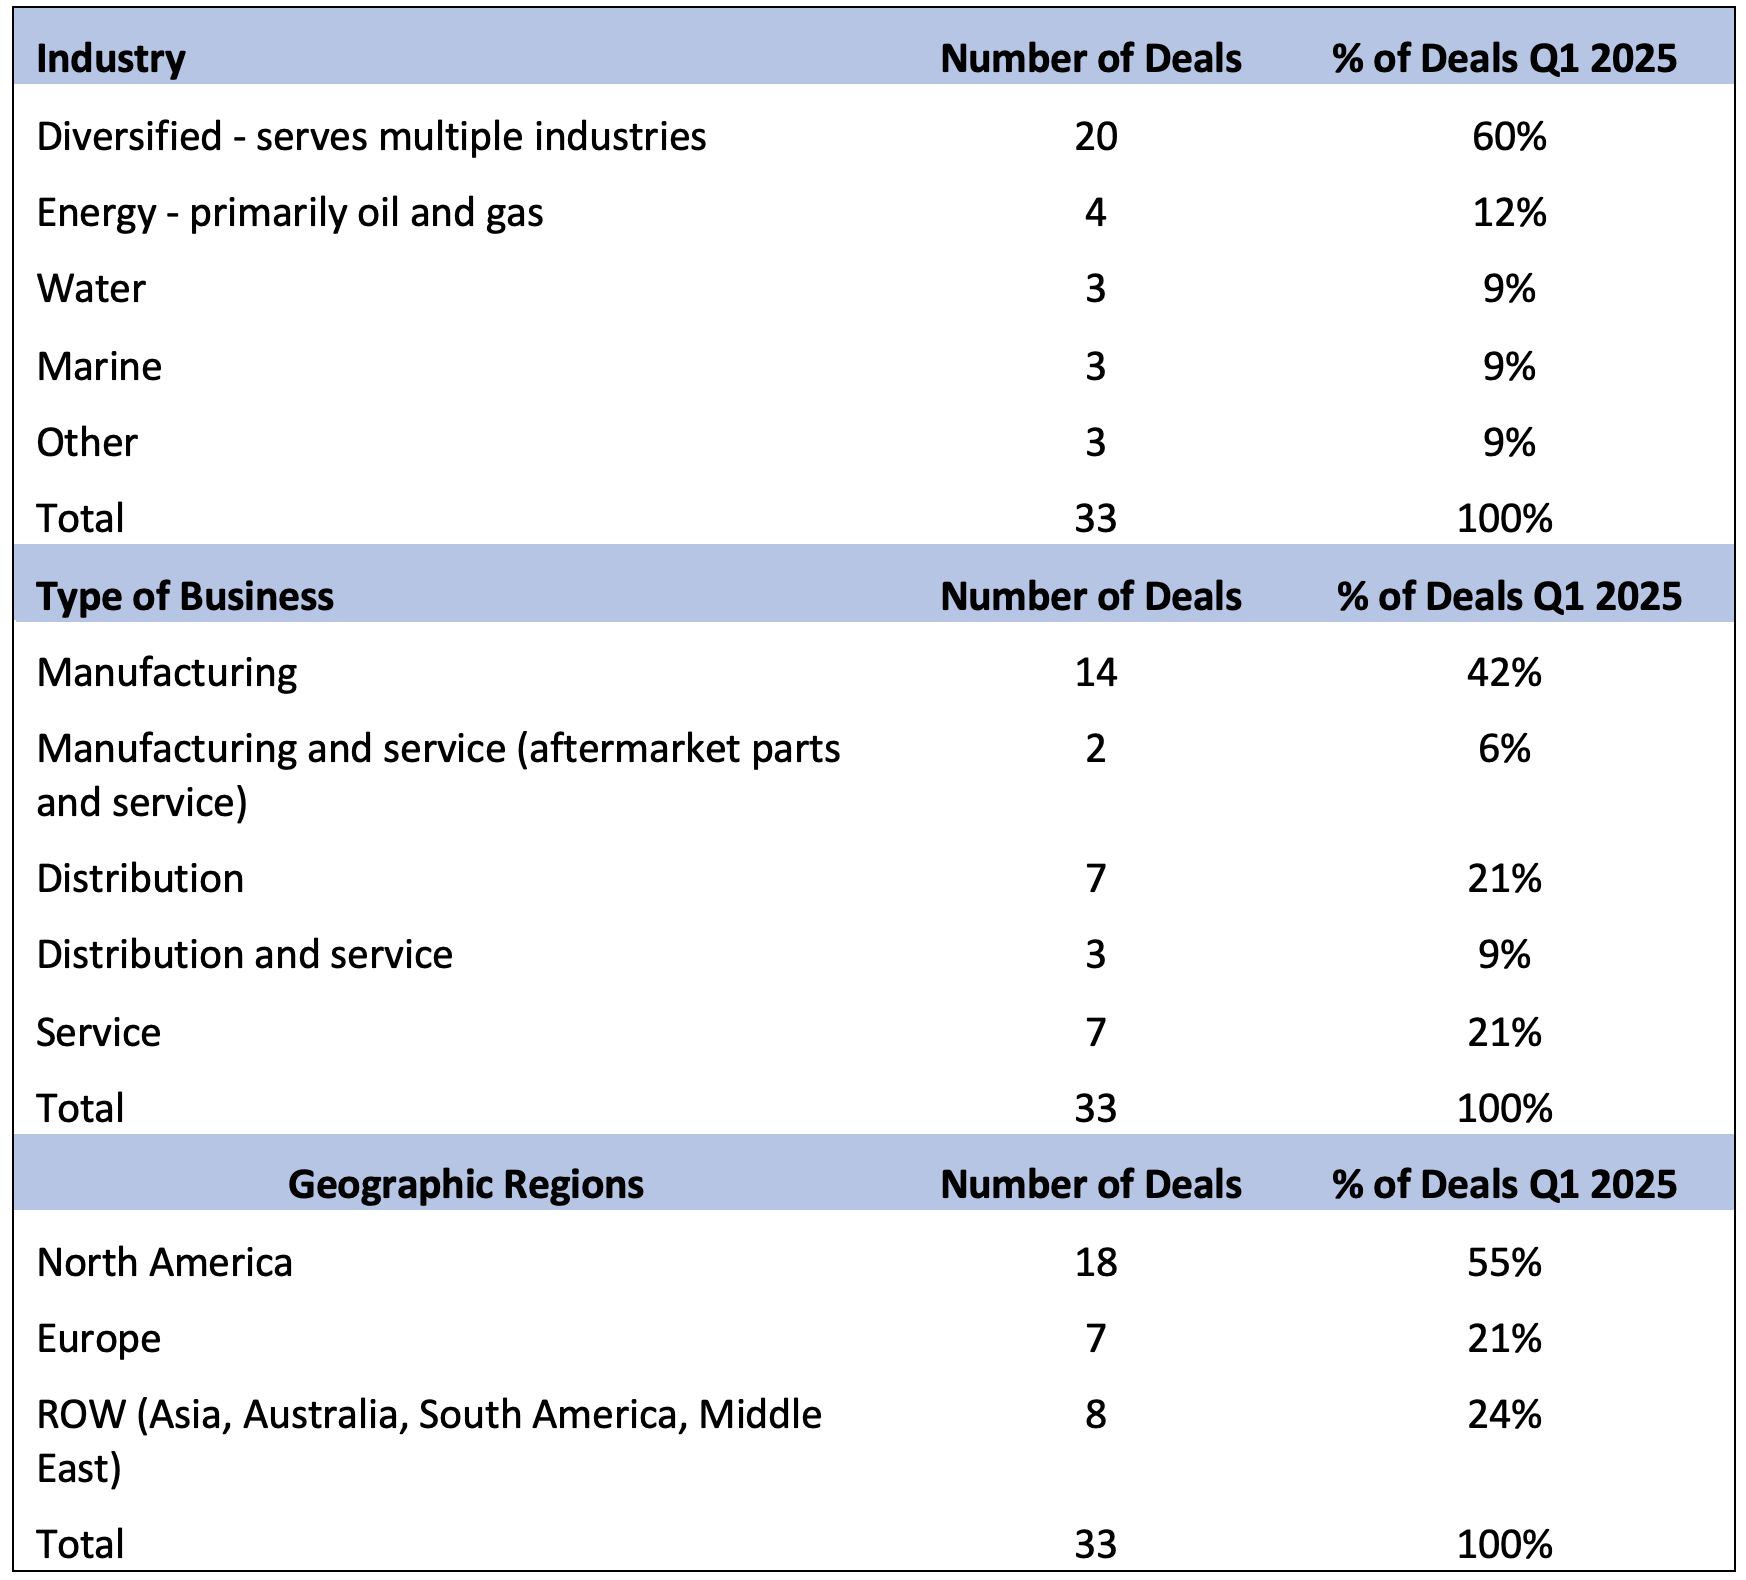
Some notable points about the target companies in Q1 2025:
- The percentage of the deals with targets serving the oil and gas market is the largest to be seen in several years, and the interest seems to be in two areas: cryogenic technology and aftermarket critical equipment service capability.
- While manufacturing targets were the single largest category, the targets that primarily serve the aftermarket make up over 50% of the target companies, as they did in 2024 as well.
- North America remains the most favored geographic region. However, the rest of the world (ROW) percentage in Q1 2025 is the most significant to be seen.
Why: Key Deal Rationales
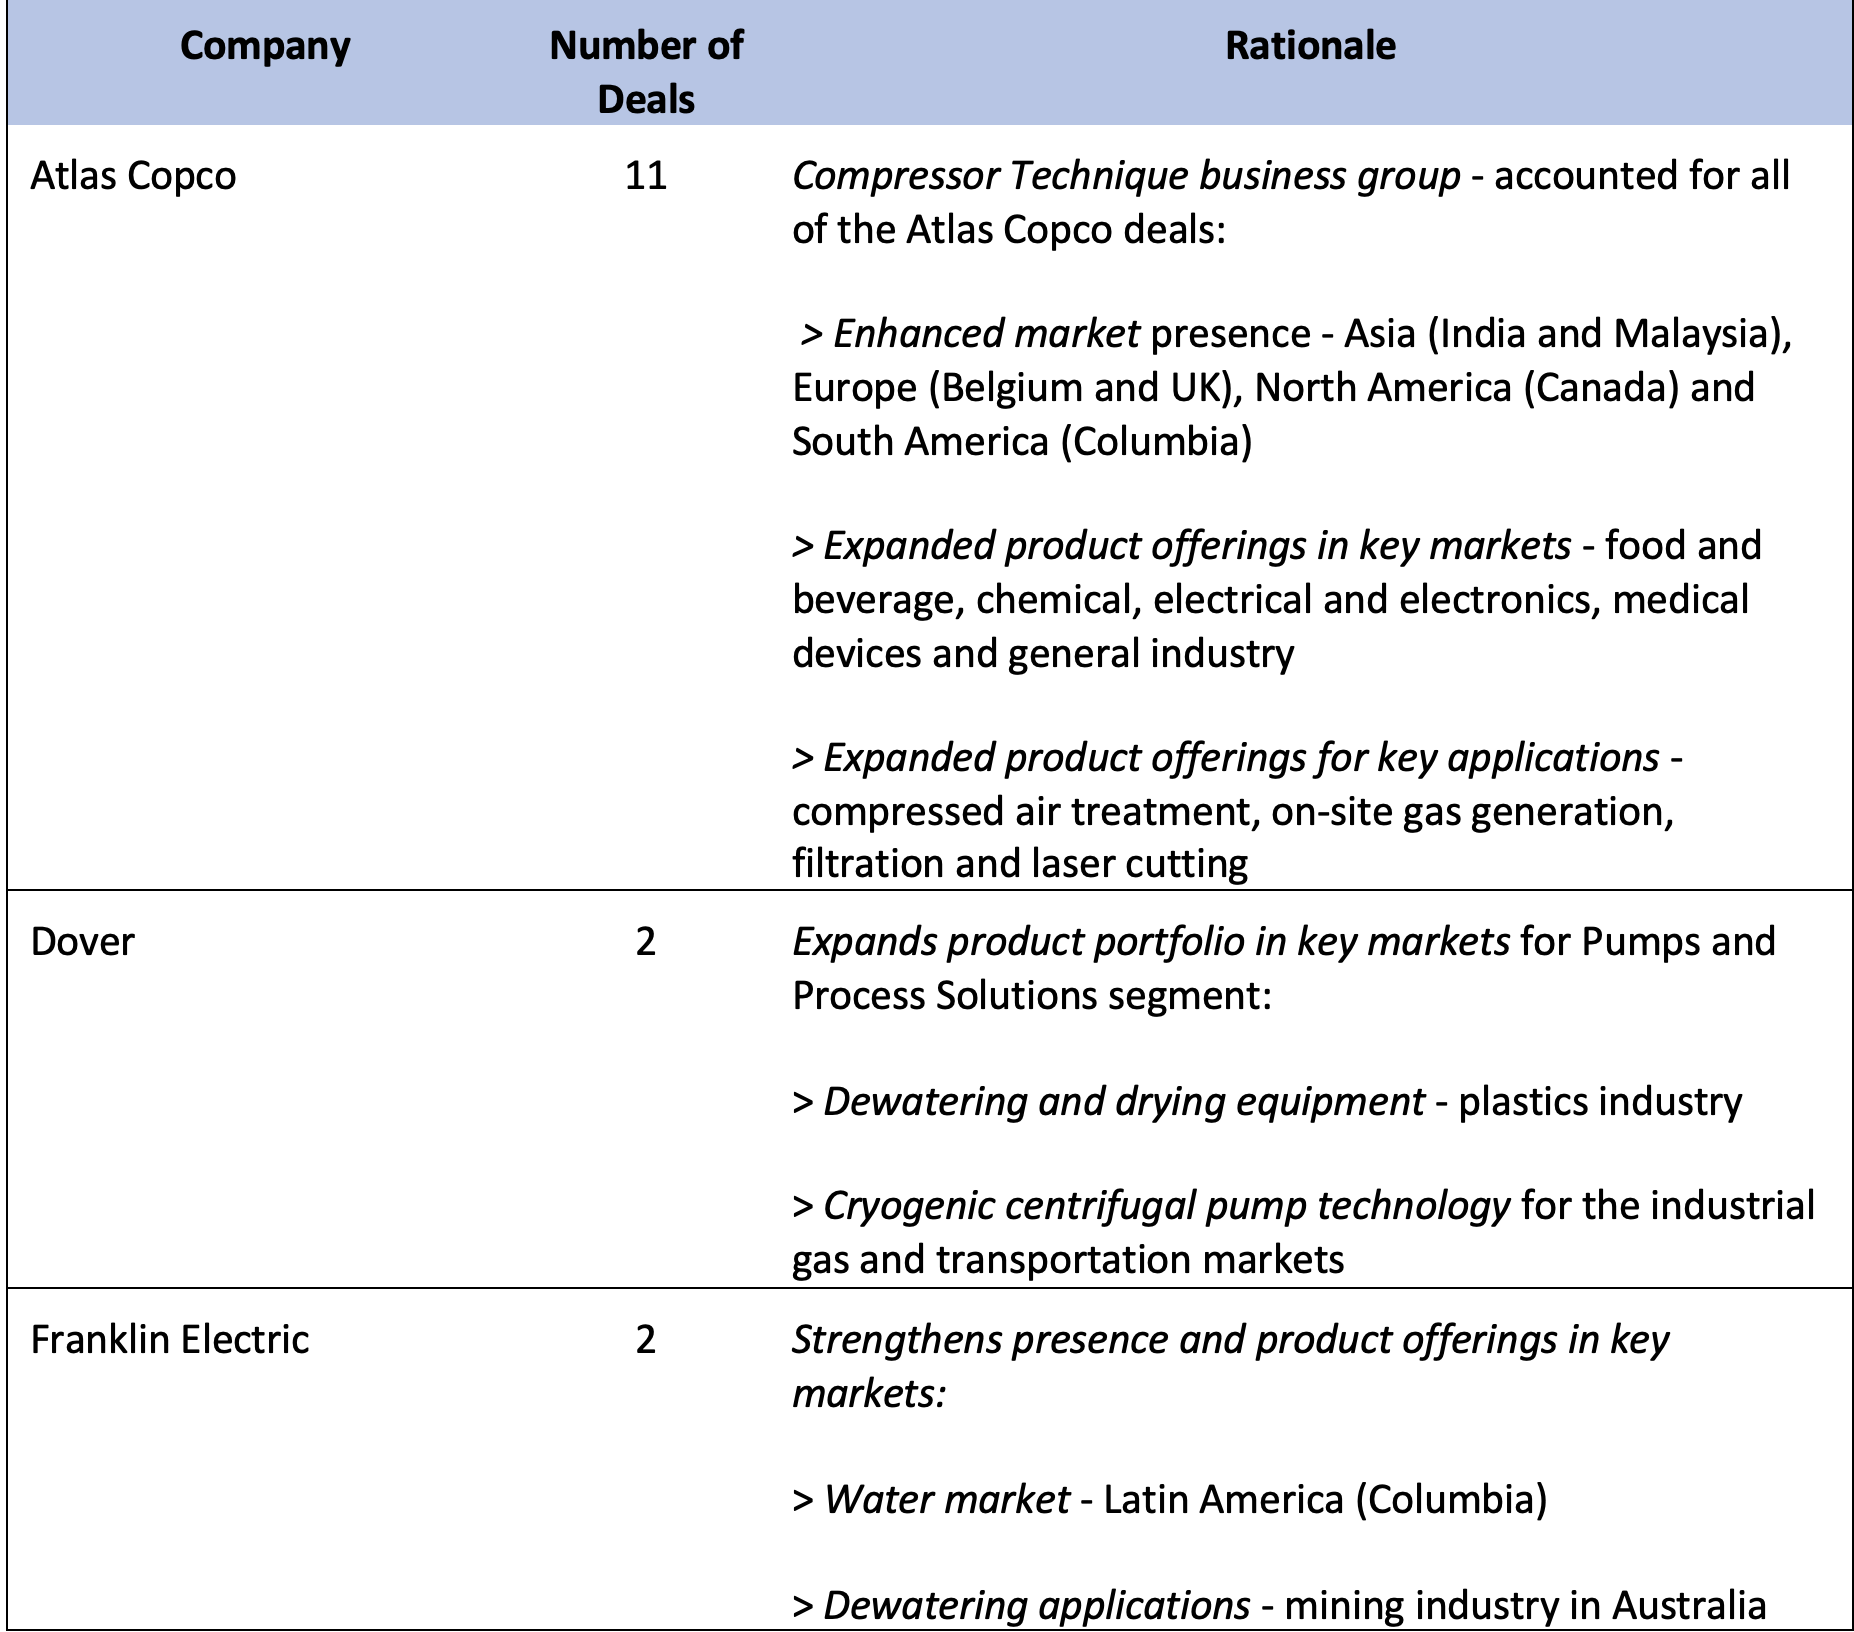
Below are the key factors motivating the largest deals and the most active companies in Q1 2025.
Largest deals:
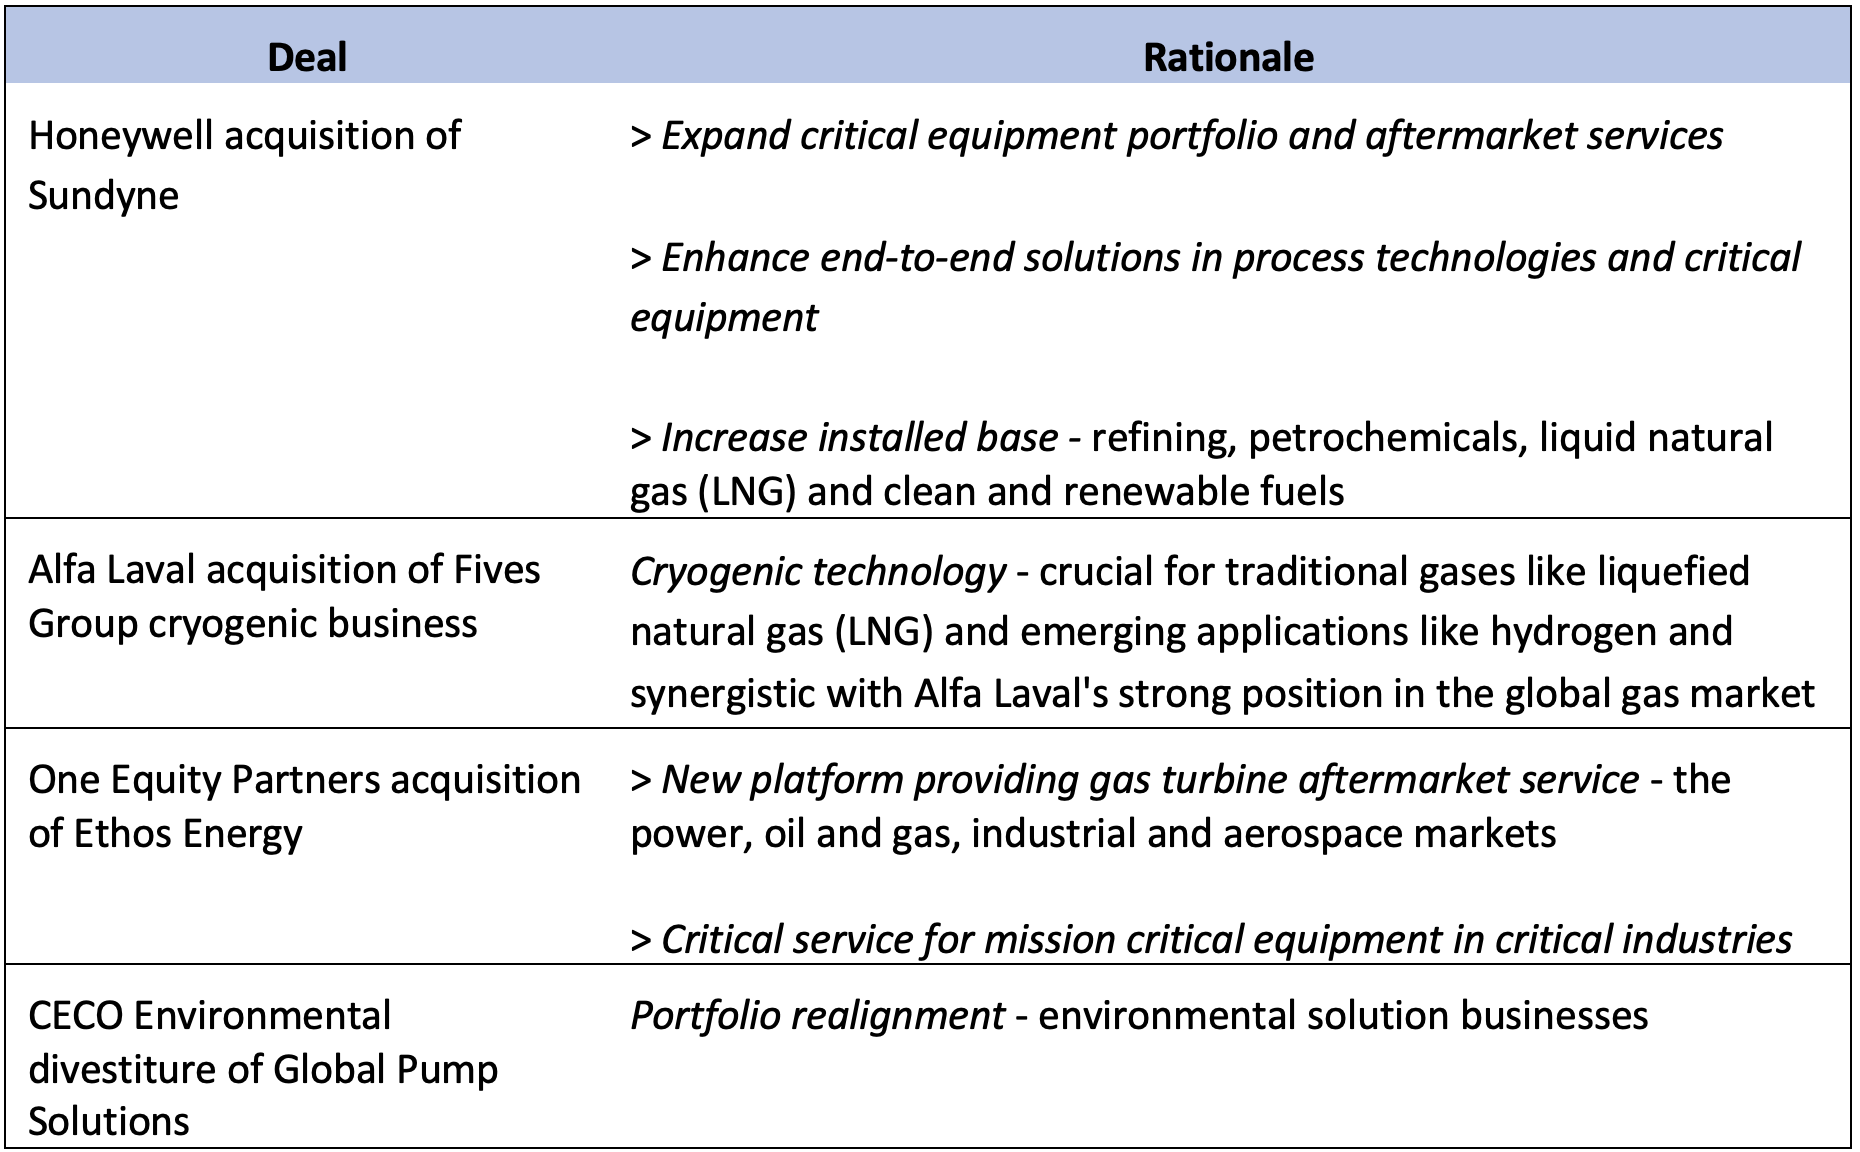
Most active companies:
Outlook
2025 started with a high level of optimism for an improved business environment and a very active M&A market, and it seems that, for the most part, fluid handling industry companies met or exceeded their Q1 2025 expectations for orders, revenue and earnings. However, despite that initial optimism and Q1 results, there is widespread uncertainty for the balance of the year.
It would be reasonable to expect that uncertainty would have a quieting impact on M&A activity to some extent. On the other hand, the rationale for the activity we see in the fluid handling space seems to be primarily driven by long-term strategies versus near-term macro factors. While the near-term conditions are likely to cause cautiousness, they are not likely to cause companies that have an active inorganic growth strategy to put that on hold or for companies to not pursue an opportunity that is seen as an attractive long-term strategic fit.
The activity levels of February and March, though much reduced from the extreme activity level of January, would still be an activity level on par with the strong activity level we have had over the last three years. Assuming the trade war threat continues to moderate and absent significant change in the growth expectations in the U.S. and Europe, our outlook would be for the level of activity for the balance of 2025 to be slower than Q1 but on par with the activity level of 2024.
We see the valuation outlook to be impacted by changes in the cost of capital (interest rates) but more so by acquirer's growth assumptions. The growth assumptions are likely to be impacted as the trade discussions evolve and by the extent to which pro-growth incentives will or will not be included in the U.S. tax bill. For now, our outlook is for the valuation levels to remain stable with the current levels, subject to the normal supply and demand fluctuations and individual company characteristics.