

Water hammer, or surge, is a notable change in pressure due to rapid acceleration of a fluid. The most universal cause of water hammer is a valve closure, in which fluid flow is rapidly decelerated causing a large increase in pressure.
During a valve closure, the kinetic energy of a flowing fluid is converted into potential energy in the form of pressure. This increase in pressure can be significant, potentially exceeding designed pipe pressure ratings. The faster the valve is closed, the more aggressively kinetic energy is converted into pressure, resulting in a higher pressure surge. The more gradually a system can slow its flow, the better a pressure surge is mitigated. Imagine gradually applying the brakes in a car compared to slamming on the brakes. By slowing down gradually, the energy is better dispersed through the system. Fluid is slowed smoothly by gradually closing valves, with a few caveats.
Generally, the longer the valve closure, the less pressure surge will occur. Often there are design heuristics to “close X seconds for every X amount of pipe diameter” or based on other parameters. However, these simplified rules of thumb to mitigate a water hammer event have two potential pitfalls.
- A design heuristic is not always conservative, meaning a suggested valve closure may not effectively prevent surge. This can be caused by several different factors a simplified heuristic does not account for.
- While a rule of thumb may prevent surge, it may be overly conservative and lead to unnecessarily long closure times. In emergency conditions, such as an emergency shutdown, the fastest possible closure within the allowable pressure surge is ideal.
Instead, if the focus is on a system’s reaction to a transient event and predicting a response through modeling, an engineer can mitigate (or ideally, completely avoid) the pitfalls of heuristic-based closures.
What Is Effective Closure Time?
While lengthening a valve closure time should theoretically mitigate a surge event, it is not always a direct relationship to slow flow.
Remember, a valve closure’s pressure increase is caused by decelerating the fluid. If a 20-second valve closure does not begin decelerating the fluid until halfway through the process, the effective closure time is only 10 seconds. The effective closure time can be defined as the amount of time spent actively reducing flow rate during a transient. In the example, if the same valve is instead closed over 40 seconds, the effective closure time only increases to 20 seconds.
A real-life example explored water hammer surge from a subsea pipeline valve closure. The engineer compared a 20-second valve closure to a 600-second closure in water hammer modeling software, but as seen in Image 1, the effective valve closure time was still short. The rapid deceleration of the fluid resulted in a drastic pressure response in each tested case, despite the longer overall closure time.
What Causes Effective Closure Time to Differ From Overall Closure Time?
Valve closures are impacted by two major factors: the valve’s inherent characteristics unique to how the valve is constructed and the valve’s installed characteristics—how a valve interacts with a system.
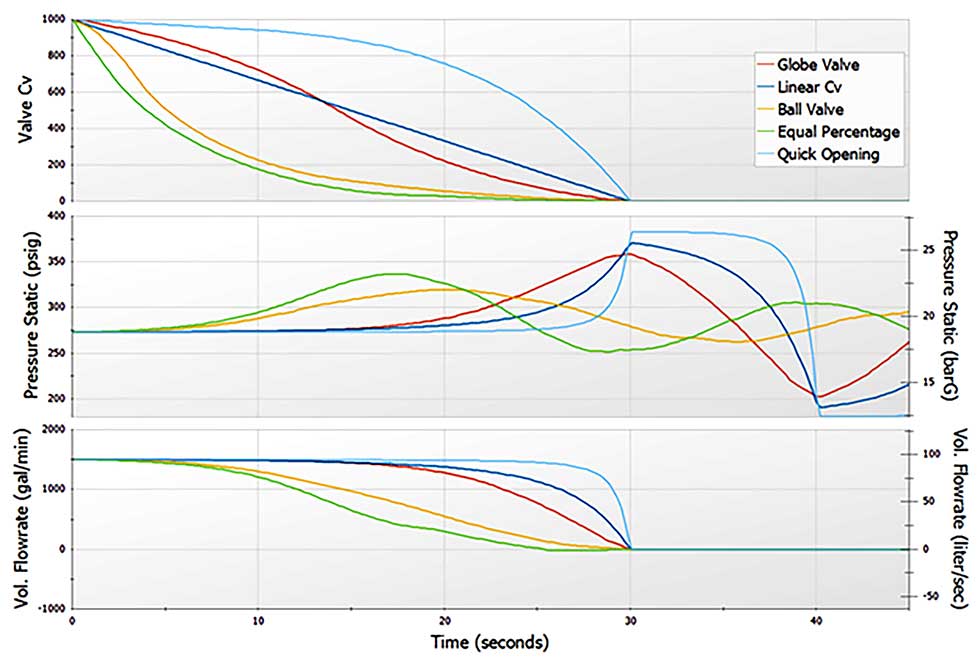
A valve’s inherent characteristics inform two things about a valve closure. First is the shape of a valve’s closure in the form of a characteristic curve. For example, the rate at which flow is reduced as a ball valve closes will be drastically different from the rate as a globe valve closes. Image 2 isolates these characteristic curve effects by closing valves over the same amount of time from the same starting point. It is clear how a valve’s construction impacts its ability to slow flow over a closure, which in turn impacts its pressure response.
The second factor for a valve’s inherent characteristics is the starting loss of the valve at full open. For example, globe valves generally cause higher losses than similarly sized gate valves. Thus, if both types of valves were closed over the same time, the globe valve would create more loss earlier and, thus, start reducing flow sooner, resulting in a longer effective closure time.
This necessary loss to control flow is informed by the overall system, making it an installed valve characteristic dependent on the system. For example, take a garden hose that users can cover with their thumb to control flow. When the hose is not kinked, the thumb causes most of the overall system losses and users can easily control the flow. However, if the hose is kinked and the normal system losses are quite high, the same thumb covering will less effectively reduce flow, if at all. This is the relationship of valve-specific losses to overall system losses, and the result on flow rate is found in Image 3.
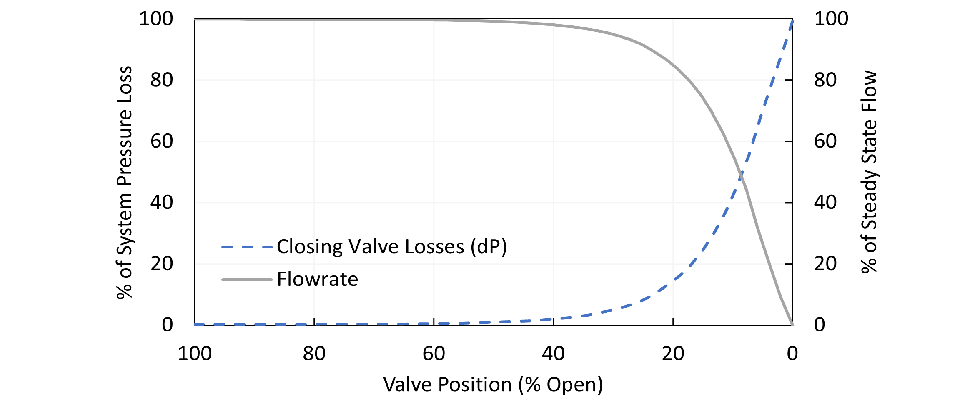
These nonvalve system losses can be caused by many things, such as overcoming elevation change, fittings in a pipeline, and pipe parameters like increasing length and reducing diameter. When a system has losses elsewhere, it takes more loss through a valve for it to start controlling and reducing flow. This means the first part of the closure is often ineffective, reducing the effective closure time.
What Is a Better Valve Closure Design?
With effective closure time in mind, there are many approaches to quickly close valves without causing a large surge event.
- Determine where a valve starts reducing flow and reach that point as early in the closure as possible. Since flow should not be reduced through this initial part of the closure, there is not a pressure surge to worry about.
- Consider the valve’s characteristic curve to stage a closure event. How a globe valve and ball valve should be closed may be drastically different.
While design heuristics and rules of thumb are a good first approximation, the most reliable way to predict a system response is through modeling. Modeling a system allows for rapid iteration and design alternative testing before field implementation or purchasing components. Modeling provides confidence in a design while avoiding the typical pitfalls of heuristic-based design. Especially since a valve closure response is highly dependent on the valve’s surrounding system, creating a curated closure is easier in software where a model is customizable.
References
