A system with parallel pump operation consists of two or more pumps that are configured such that each will draw from the same suction reservoir, wet well or header, as well as discharge to the same reservoir or header. Put more simply, if the head loss in the pumps’ individual suction and discharge piping is similar, this means that pumps in parallel will operate at the same total head or differential pressure but will also share the total flow rate.
Pumps operating in parallel allow the pumping system to deliver greater flows than is possible with just one pump. However, prior to understanding how much the system flow rate will increase due to parallel operation, users need to understand the pump system curve and how a parallel pump curve is generated based on the individual pump curves.
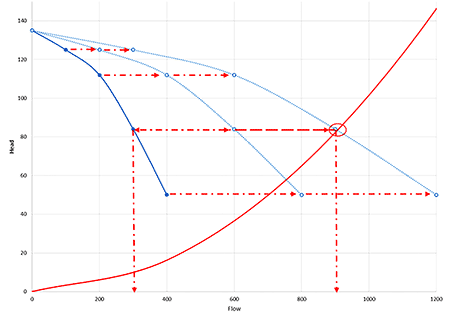
To determine the composite pump curve of two or more pumps operating in parallel, at each head value, the flow rate of each pump must be added together to obtain the composite flow rate.
Image 1 shows an example of a single pump curve, along with curves for two and three identical pumps operating in parallel. The red arrows illustrate that a composite pump curve can be drawn for identical pumps by adding the flow rate at a respective head. The system flow rate is the point where the system curve intersects the composite pump curve. In this example, three pumps operating in parallel would have a flow of 900, and each pump should be contributing a flow rate of 300.
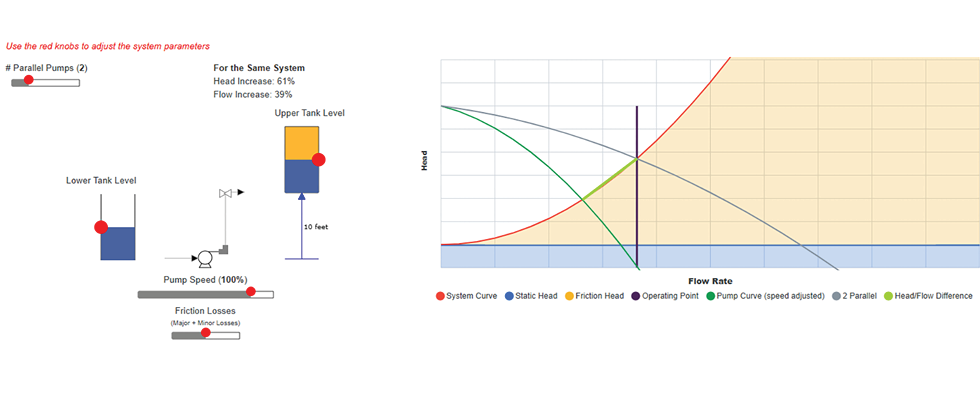
To learn more about the dynamics of system flow and head change based on operating pumps in parallel, use the Hydraulic Institute (HI) Data Tool, which is a free website that provides pump and system definitions, resources, references, fundamental knowledge, interactive pump system demonstrators, fluid property data, fluid flow equations and easy-to-use pump system calculators. Within the pump fundamentals section of the site, a parallel pump interactive demonstrator is provided that helps to visualize how flow rate and head will change when operating additional pumps in parallel.
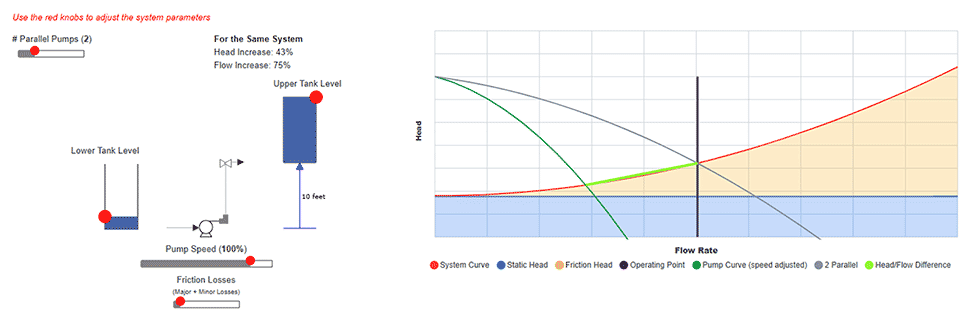
Images 2 and 3 are examples of the parallel pump demonstrator. For these examples, the system curve (red) intersects the parallel pump curve at different locations, which illustrates that the amount of flow rate increase will depend on the shape of the pump curve and system curve. For Image 2, the system curve is steeper, which results in a flow rate increase of 39%. In Image 3, the system curve is flatter, which results in a flow rate increase of 75%. Using this demonstrator, users can also vary the pump speed and increase the number of pumps to see the effect on flow rate.