
Pump System Improvement
06/06/2016
My longtime readers know that a piping system is made of three parts: the pump elements, process elements and control elements. The pump elements add all the energy needed to move the fluid through the system; the process elements make the product or provide the service; and the control elements improve the product or service quality. Understanding how these various elements work together provides a clear picture of how the system works.
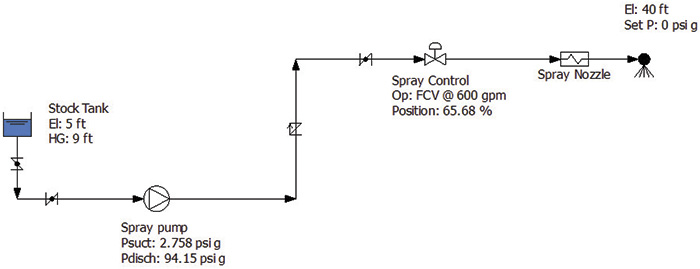 Figure 1. The example piping system. (Graphics courtesy of the author)
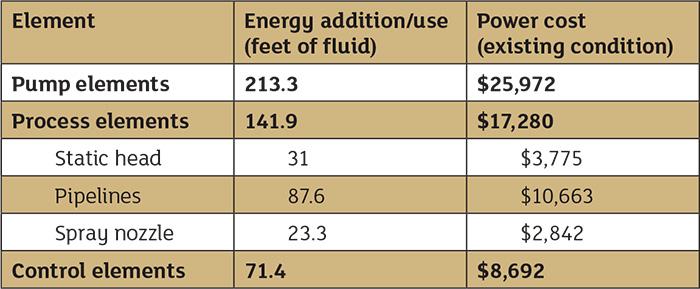 Table 1. Power cost balance sheet for the spray system prior to system improvements
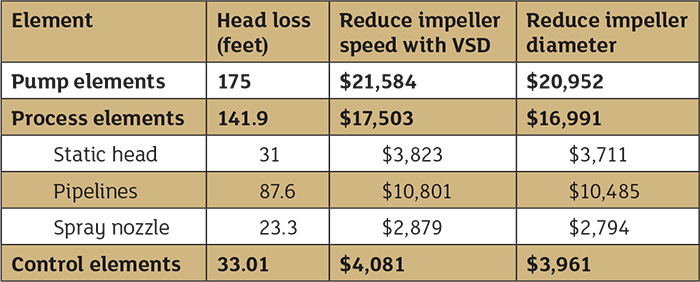 Table 2. Comparison costs of reducing impeller speed by incorporating a VSD and reducing impeller diameter
See more Pump System Improvement articles by Ray Hardee here.
