

With the industrial internet of things (IIoT), users must consider the 7-layer technology stack of sensors, connectivity/edge computing, global infrastructure (cloud, private/public/hybrid), platforms/data ingestion, data analysis, applications and people/process to unlock the true value. The issue is that no OEM, cloud platform or analytics firm has the skills to master each part of the technology stack. There is talk of “more data” to see complex or nuanced patterns, machine learning to learn and adapt—but what does that all mean?
In addition, the output must result in technicians or plant engineers taking action from the sensing capabilities in advance of asset problems to justify costs and process changes. Thus, all of the above mentioned has to be seen through the lens of machine reliability, conditions that are leading indicators that technicians can address, and be integrated into existing workflows with an economical price point. The power of big data and combining data sets has the potential to identify patterns that can drive new behavior for cost savings.
This case study on pumps underlines the right data, focusing on ultrasonic frequency of vibration data that points to lubrication and bearing fault defects (over two-thirds of issues can be remedied with lubrication); 30-60-90 day advance notice of issues to technicians and computerized management maintenance systems (CMMS) generate work orders to be acted upon. The 30-60-90 day advance notice is important for technicians who have a long list of existing issues. Integration into existing work order systems is critical via application programming interface (API) and automated data connectors to be received, understood and acted upon.
Field technicians typically do not have the time or inclination to look at data visualizations. An AI-engine must be designed to classify problems by severity and order work instructions. The entire IoT program must be planned out, and machine learning does not catch preexisting conditions as it baselines from brownfield asset fleet. There is not an easy, quick fix.
The firm adopting the technology must also have a vision of digital transformation and a systemic issue large enough that throwing labor or bodies at the issue cannot solve it entirely. In other words, the status quo cannot keep with growing work demands in order to fuel growth. In addition, the coronavirus pandemic has shown that new remote work capabilities are accelerated at a faster pace.
Case Study
One water technology company has a build, own, operate (BOO) reverse osmosis system at a large Midwest refinery. The system provides 100 percent of the critical water needed for plant operations. System redundancy helps meet the full uptime customer requirements. Redundant systems are cycled to ensure proper operating conditions.
A vibration monitoring trial was performed over four months to understand how this technology could support asset management efforts. During the trial, vibration data was combined with operational data to gain additional insights. Faulty valves, questionable pumps and the actual level of system redundancy, versus theoretical, was discovered. The refinery’s water demand had increased over time, resulting in the need to run redundant systems to meet peak demand requirements. Insight into actual system redundancy helps with risk management and new asset justifications.
Data science techniques for assessing the pump system as a whole were deployed for additional insight. Two points were established using data science:
- Detecting an impaired redundant pump system that runs in simplex 38.6 percent of the time
- Detecting pump interaction on a common header due to incorrectvalve position
Redundant Pump System Analysis
In critical pump applications it is common to have redundancy schemes. These redundancy schemes can be 1 to 1 or 1 to many. Typical challenges with multiple pumps on a common header include:
- runtime balancing
- cavitation during pump switch over
- improper manual or automated valve sequencing
- running too few or too many pumps
- early wear out or seal failure due to improper operation
- missed fault detection due to pump not running
- missed preventative maintenance due to pump not running
If the common challenges can be monitored, visualized and alerted, then the most frequent risks can be reduced, resulting in improved pump reliability and life span. Pump reliability is often measured in mean time between failure (MTBF). An increase in MTBF indicates an improvement in pump life and plant reliability. It is common for a pump designed for a 20-year life to only last five to seven years.
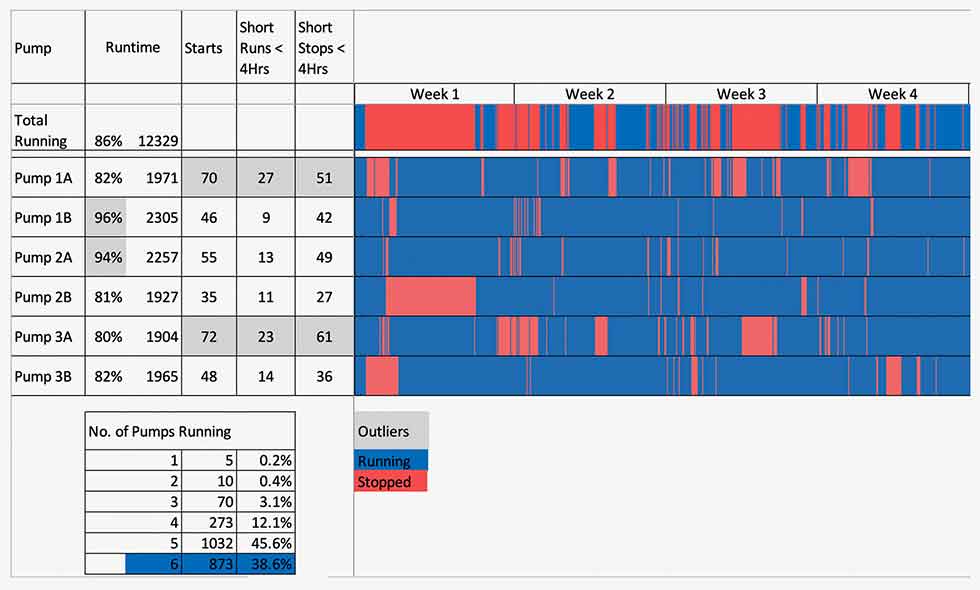
Multiple industry studies agree that a common cause of failure for redundant pump applications is improper operation or maintenance. The data in the heatmap (Image 1) is of a 1:5 redundant pump application and shows the backup, or sixth pump, is actually running as primary mover for 38.6 percent of the time (blue in Row 1). This means the pump system is running in a simplex and not redundant mode for 38.6 percent of the time. The drill down information for the operation of each of the six pumps is shown in Rows 2 to 7. The short red slices indicate the pump cycled off for a very short time period and then restarted. Due to insight from the visualization, the control scheme is being evaluated for starting and stopping the pumps. At the bottom of the report is a table histogram of the number of pumps in service.
Correlation of Pump Interaction on a Common Header
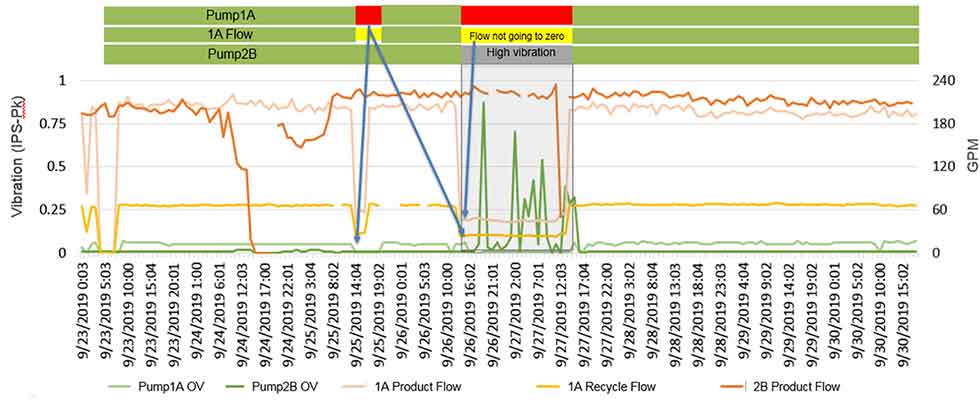
The second insight created using a data science framework is a correlation between high vibration in one pump as a result of a second pump being turned off. Image 2 shows a seven-day trend of pump vibration and pump flow. The green and light green lines show the overall vibration levels of the two pumps. The orange and light orange lines show the product flow of the two pumps. And lastly, the yellow line shows the recycle flow for Pump 1A. The green and red bars at the top of the image show green for a pump in service and red for a pump out of service. The yellow bar shows an issue were the Pump 1A is flowing through during its stopped condition—this is not a normal condition. Further, the gray bar shows when a high and sporadic vibration is occurring. The bar visualization makes it easy to see the correlation between Pump 1A stopping and Pump 2B incurring high vibrations.
Using a modified correlation technique, the second insight was found. Image 2 shows turning off Pump 1A caused a high vibration occurrence in Pump 2B. Further investigation found that during manual switching of the pump, a manual valve was incorrectly positioned, resulting in sporadic high vibrations of Pump 2B. Again, the underlying measurements were focused on individual pump health. However, by processing the data from a broader pump system perspective additional insights were gained.
Background & Resources
Vibration monitoring has been around for more than 30 years and information is available to understand how much vibration is too much for each type of asset—including pumps, fans, large and small pipes, bridges, etc. Refer to ISO 10816 for more information on vibration monitoring for machinery.
Ultrasonic has also been around for 30 years; however, it initially focused on thickness testing and then leak detection. More recently it has been used for mechanical and electrical failure detection. ISO 29821 is the standard for ultrasonic condition monitoring of machines. The standard does not include the maturity of vibration monitoring when it comes to a measurement standard or an alert standard. Several companies have well-established information for setting alerts for ultrasonic measurements.
Data science is a relatively new and growing field of study at the intersection of statistics, computer science and graphical design. A common framework in data science is to ingest data, convert data through calculations, learn relationships and build mathematical models to automate analysis efforts and predict future occurrences.
Automated Analysis
With the end in mind, the ultimate destination for any monitoring or information system is to create insight that results in a decision and productive action. A common pitfall for monitoring systems is the lack of correlation and visualization tools for assessing multiple pumps or assets as a related system. With smarter sensors and now smarter systems, this pitfall is being filled. Monitoring systems include several layers of visualization and analysis, thus enabling meaningful overviews as well as drill down into system health, correlation views and finally, individual pump health.
Both vibration and ultrasonic measurements with strong data analysis and visualization tools can create concise artificial intelligence models—like an artificial intelligence decision-tree—to create context-based recommendations. A concise artificial intelligence model keeps the model relevant and extensible across a broad range of assets and applications, bringing the right data to the right person at the right time.
