
The Jordan, Knauff & Company (JKC) Valve Stock Index was down 21.5 percent over the last 12 months, while the broader S&P 500 Index was up 4.5 percent. The JKC Pump Stock Index also decreased 22.4 percent for the same time period.1 The Institute for Supply Management's Purchasing Managers' Index (PMI) rose to 53.5 percent for the month of June compared with 52.8 percent in May. The Employment Index rose 3.8 percent to 55.5 percent for the month, while the New Orders Index grew to 56 percent from 55.8 percent in May. The overall PMI has averaged 52.6 percent through the first half of the year, less than the average of 56.9 percent seen in the second half of 2014. The Production Index averaged 61.6 percent in the second half of last year while averaging only 54.8 percent during the first quarter of this year.
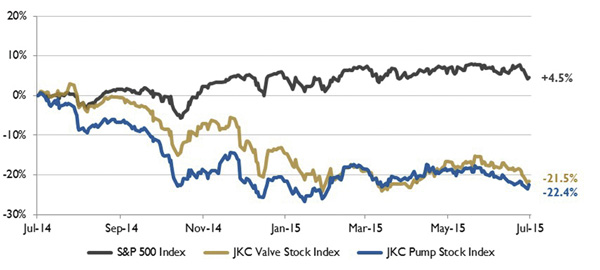 Figure 1. Stock indices from July 1, 2014, to June 30, 2015
Source: Capital IQ and JKC research. Local currency converted to USD using historical spot rates. The JKC Pump and Valve Stock Indices include a select list of publicly traded companies involved in the pump and valve industries weighted by market capitalization./div>
The Bureau of Labor Statistics reported that nonfarm payroll employment rose by 223,000 in June, and the unemployment rate decreased to 5.3 percent. Job gains occurred in professional and business services, healthcare, retail trade, financial activities, and transportation and warehousing. The manufacturing sector grew by 4,000 jobs, compared with an increase of 64,000 in professional and business services. In the first half of the year, manufacturing has added an average of just over 6,000 workers per month. Nonfarm employment increases averaged more than 250,000 per month for the past 16 months and surpassed 200,000 in 14 of the past 16 months.
The Census Bureau reported that total construction spending rose 0.8 percent in May while rising 5.9 percent during the first five months of the year. It is up 8.2 percent over 2014. New home sales activity was at its highest level in seven years in May. Private nonresidential construction increased 1.5 percent during the month and is up 12.7 percent year over year.
Figure 1. Stock indices from July 1, 2014, to June 30, 2015
Source: Capital IQ and JKC research. Local currency converted to USD using historical spot rates. The JKC Pump and Valve Stock Indices include a select list of publicly traded companies involved in the pump and valve industries weighted by market capitalization./div>
The Bureau of Labor Statistics reported that nonfarm payroll employment rose by 223,000 in June, and the unemployment rate decreased to 5.3 percent. Job gains occurred in professional and business services, healthcare, retail trade, financial activities, and transportation and warehousing. The manufacturing sector grew by 4,000 jobs, compared with an increase of 64,000 in professional and business services. In the first half of the year, manufacturing has added an average of just over 6,000 workers per month. Nonfarm employment increases averaged more than 250,000 per month for the past 16 months and surpassed 200,000 in 14 of the past 16 months.
The Census Bureau reported that total construction spending rose 0.8 percent in May while rising 5.9 percent during the first five months of the year. It is up 8.2 percent over 2014. New home sales activity was at its highest level in seven years in May. Private nonresidential construction increased 1.5 percent during the month and is up 12.7 percent year over year.
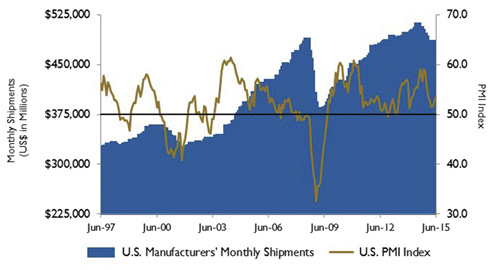 Figure 2. U.S. energy consumption and rig counts
Source: U.S. Energy Information Administration and Baker Hughes Inc.Figure 3. U.S. PMI and manufacturing shipments
Source: Institute for Supply Management Manufacturing Report on Business® and U.S. Census Bureau
Figure 2. U.S. energy consumption and rig counts
Source: U.S. Energy Information Administration and Baker Hughes Inc.Figure 3. U.S. PMI and manufacturing shipments
Source: Institute for Supply Management Manufacturing Report on Business® and U.S. Census Bureau