

In my previous article (May 2020, read it here), we discussed the importance of developing an accurate history of the pump system in question by engaging all parties with a vested interest in the system, as well as equipment OEMs, engineering firms, third parties and contractors.
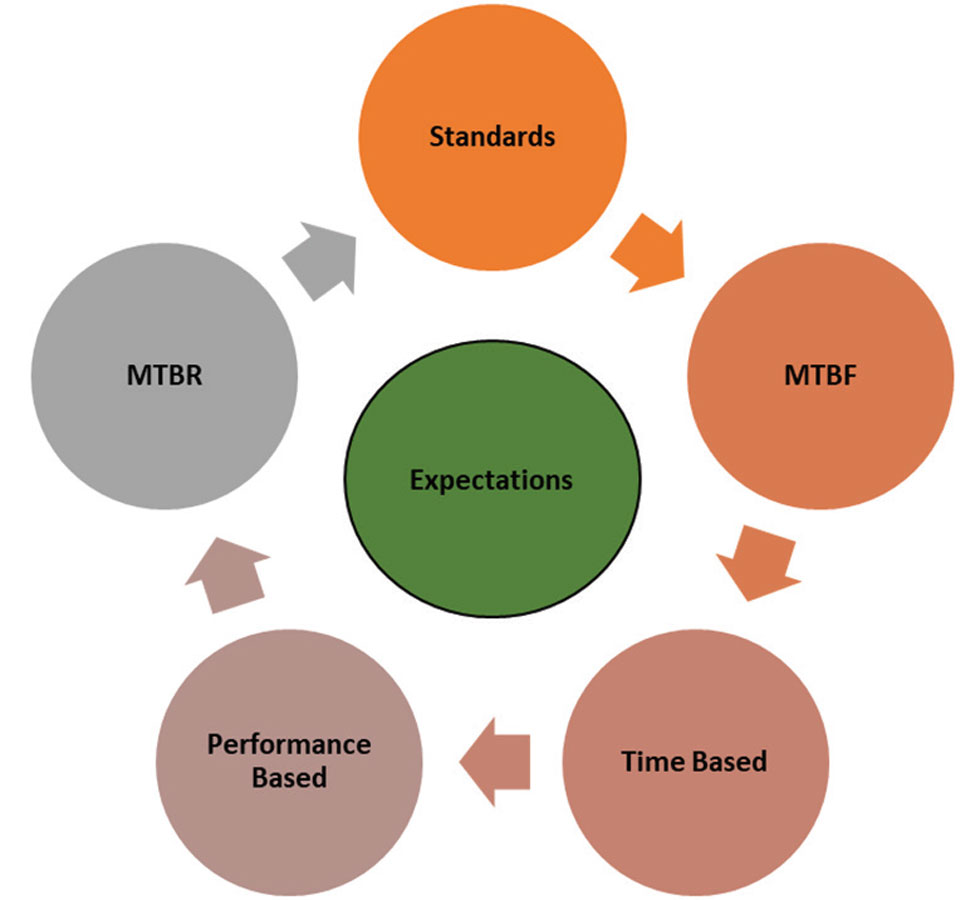 IMAGE 1: Address management’s expectations before continuing on with the analysis. (Images courtesy of the author)
At this point in the root cause failure analysis (RCFA), we have documented financial implications to justify moving forward with the RCFA (we will address additional financial implications as we work through the failure analysis), and compiled a history of the system in question.
Asking the Right Questions
As stated in last month’s article, a key component in the RCFA process is asking the right questions and should not be limited to the history segment of the RCFA. In fact, the entire failure analysis process revolves around a structured process driven investigation. Every step of the investigation requires the right questions.
Customer Expectations
Identifying and understanding the customer’s expectations upon successfully identifying the root cause(s) and implementation of corrective action(s) is another step in the investigation process. What the RCFA team considers a success may be different than what the system owner/management would classify as a success.
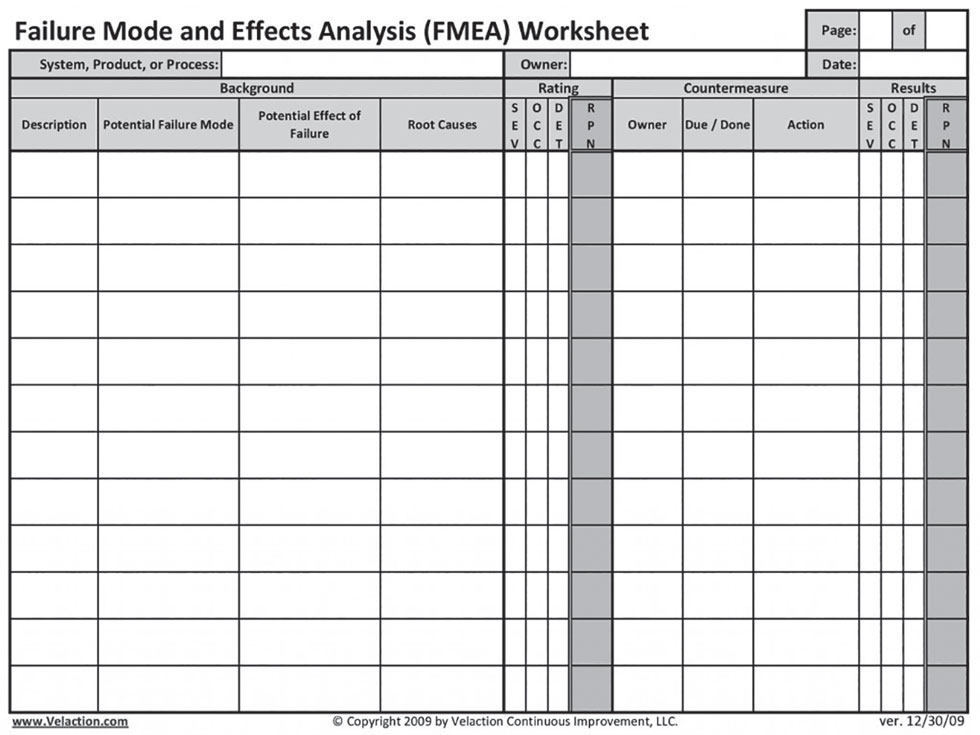 IMAGE 2: Spreadsheet example
For example, when questioning management on the boiler feedwater pump (BFWP) (see last month’s article) the plant manager indicated he would be happy with five years mean time between repair (MTBR). By comparison, the RCFA team was thinking more along industry expectations of 10 to 15 years. Management’s expectation could go in the opposite direction as well, expecting an unreasonable or unachievable MTBR. In this case, management’s expectations must be addressed and agreed upon before continuing with the analysis.
The takeaway here is to be careful with what you commit to. Don’t make promises beyond end user expectations unless you and the team are confident that you can deliver.
The Analysis Process
Merriam-Webster describes analysis as “a detailed examination of anything complex in order to understand its nature.” For the analysis phase of the RCFA, we will be doing exactly that—breaking down the pieces to fully understand the big picture.
Analysis Deliverables
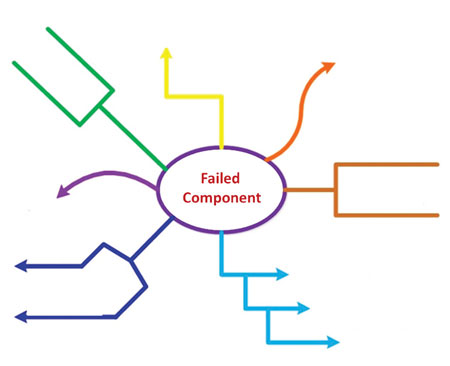 IMAGE 3: Mind map example
- Cause and effect analysis was performed on the problem.
- Cause and effect analysis was taken to a detailed and actionable level.
- Root causes were selected and identified and documented for corrective action.
- Data collected was used to verify the root cause(s).
There are several ways to structure the analysis process in order to meet the deliverables as outlined.
- Excel spreadsheet
- mind map
- fishbone diagram
My personal favorite is the Ishikawa diagram. Named after the creator Kaoru Ishikawa, Ishikawa diagrams were popularized in the 1960s. Ishikawa pioneered quality management processes in the Kawasaki shipyards, and in the process he went on to become one of the founding fathers of modern management.
The basic concept was first used in the 1920s and is considered one of the seven basic tools of quality control. It is commonly known as a fishbone diagram because of its shape, like the side view of a fish skeleton. It is also known as a herringbone diagram, cause-and-effect diagram or Fishikawa.
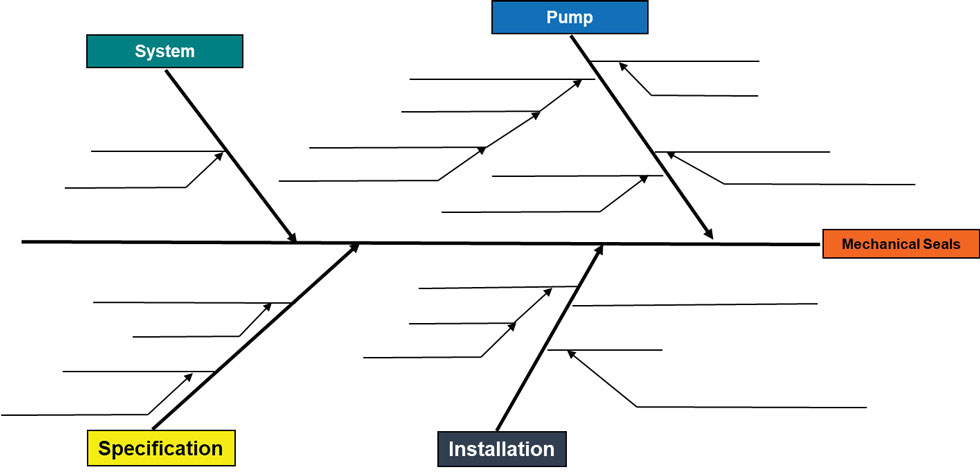 IMAGE 4: Ishikawa diagram: four major bones/categories
All three (spreadsheet, mind map and Ishikawa) serve a similar purpose—allowing the team to collectively pull together and brainstorm and document potential causes and effects.
For the purposes of this series of articles, I will use the fishbone diagram to illustrate how the cause and effect brainstorming process works.
I chose the Ishikawa diagram due to the:
- visibility of each potential cause and effect
- ability to identify root cause multiple times in the same or different bone
- ability to display the big picture for the team members and management
- easy to understand/excellent visualization
Cause & Effect
The defect is shown as the fish’s head, facing to the right, with the causes extending to the left as fishbones; the ribs branch off the backbone for major causes, with sub-branches for root-causes, to as many levels as required.
There may be multiple failed components (such is the case with the BFWP we will be using as a case study). A fishbone diagram may be required for each failed component to avoid confusing cause and effect.
Brainstorm Session
As I have repeatedly stated, the RCFA is a team effort. The brainstorm session requires input from every member of the team, as well as others that may have or had some connection with the system in question.
The purpose of the brainstorm session is to populate the main branches of the fishbone creating a structure approach to failure mode. Using the BFWP example, we identified several modes of failure:
- mechanical seal problems from initial startup, seals failed (replaced) every three to six months (both IB and OB/random)
- coupling (shim pack) failures
- motor inboard bearing failures
Let us begin with the mechanical seal failures as this was considered a major safety issue and highest component replacement cost.
Identifying the 4 Major Bones
We begin the process by identifying potential root cause at a high level. What would cause the seal to fail? What do we know about the seal’s history?
Mechanical seal problems from initial startup, seals failed (replaced) every three to six months (both IB and OB/random)
This would lead us to consider the pump, installation, specification and the system as the four major bones, or categories, of the diagram.
Next month, we will begin populating the subcategories.
