

Two propane unloading pumps with a driver rating of 30 horsepower (hp) always operate at a high flow rate exceeding the design-rated capacity of 110 gallons per minute (gpm). During normal offloading, the pumps run at 190 gpm, which is outside the pump curve. The pumps operate at 160% of the best efficiency point (BEP), which is unacceptable. Based on the operating history, one pump is operated twice a week with an average operating duration of one hour per run. In addition, the pumps were overhauled after six years of operation. The approximate operating time between overhauls is approximately one month, which is low. These pumps are considered to have low reliability, especially since the process liquid is considered clean with no suspended solids. The propane unloading pumps are important for maintaining a safe propane level to ensure a reliable natural gas liquids (NGL) operation. Applying improvements and pump protection mitigation will prevent damage.
Investigation Process
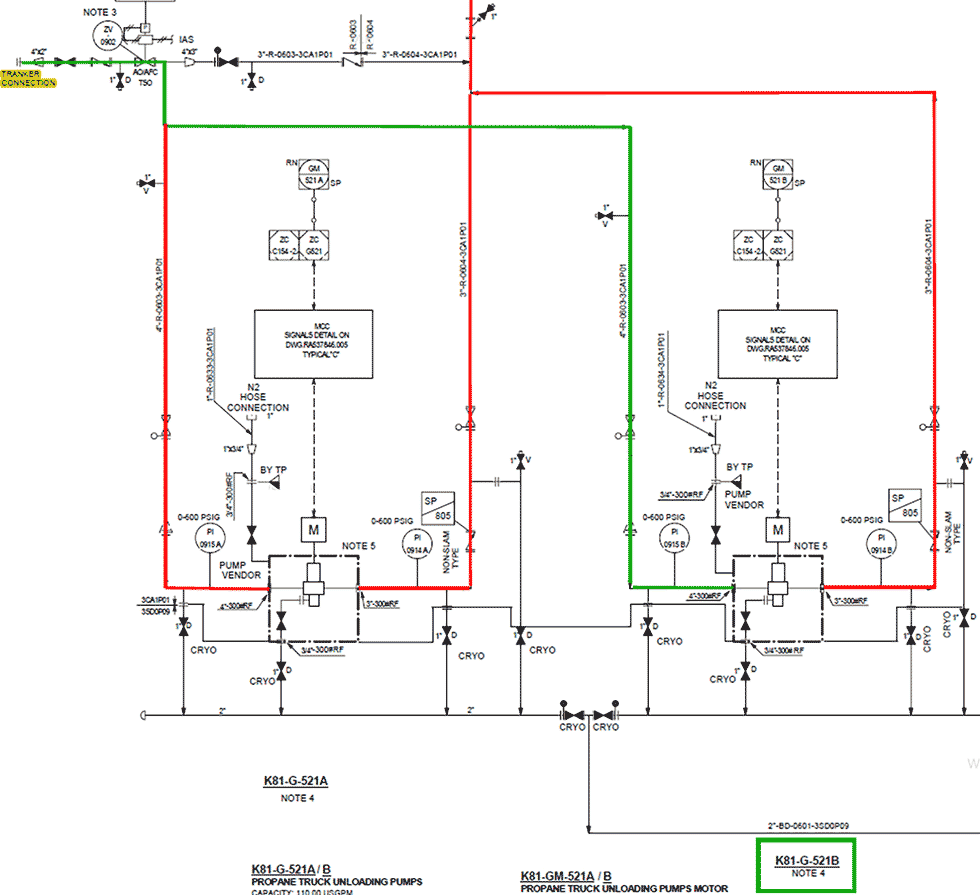
To determine the cause of the high-flow operation, the friction loss was recalculated for the piping system to find out if the pump was overdesigned or not. Thus, all related isometrics were needed. By looking at the piping and instrumentation diagrams (P&IDs), the needed piping isometrics were determined to help calculate the friction loss. The pump complete suction line isometrics were provided. The isometrics for some of the discharge lines were missing. As such, a conservative approximation of the pump’s discharge line friction was determined based on the current pump operating parameters. Thus, the Unit B suction line was considered in the calculations, as shown in Image 1 in green.
Friction Loss Calculations
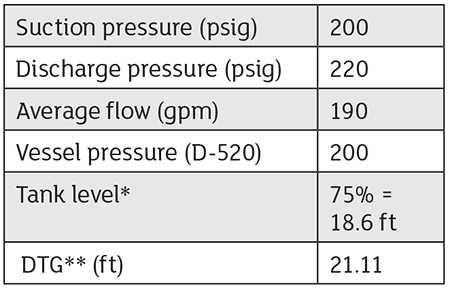
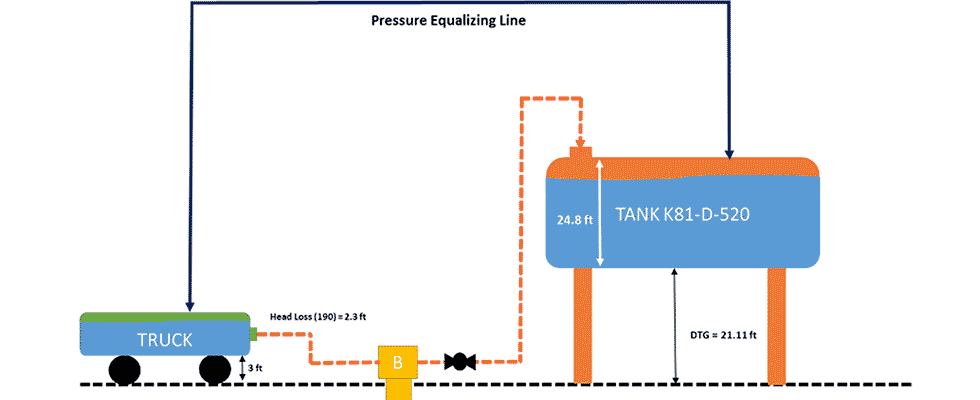
To determine the equivalent pipe friction length of the discharge piping, the actual pump operating parameters were used (Image 2). As the truck and the destination vessel have a pressure equalizing line, this means the pump’s sole mission can be divided into two tasks. The first task is to raise the liquid from the truck level to the vessel level, while the second task is to overcome the friction in the pipe connecting the two.
The first step will be determining the equivalent friction pipe length to calculate the overall head (∆Htotal) based on the received data.
The next step is to calculate the elevation head, which can be determined from Equation 2.
Since the total head is the summation of the friction head and the elevation head, the friction head can be determined from Equation 3.
Where Hfr is considered the friction head (friction losses) for the whole system (i.e., suction and discharge lines).
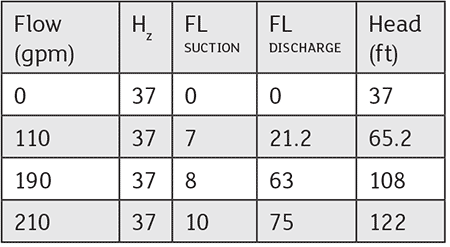
By looking at Image 1, the friction loss calculated for the suction line of Unit B is shown in Image 4 for 190 gpm and Image 5 for 110 gpm.
Strainer friction needs to be accounted for in the calculations. The normal case scenario for the strainer, which has no mesh in this case, is 1 pound per square inch (psi), which is equivalent to 3 feet (ft). Also, the friction loss from the hose should be considered as well, which is about 3 ft.
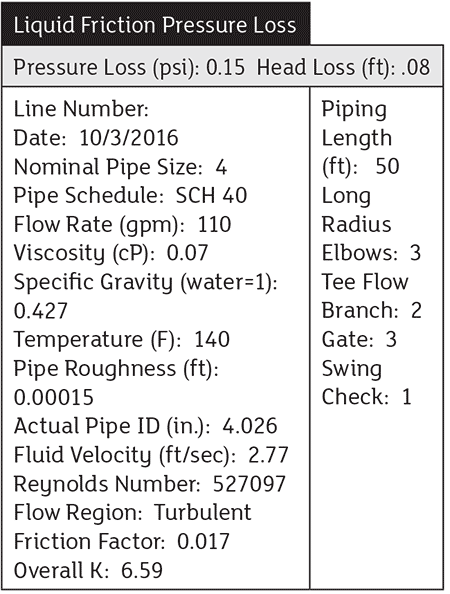
From the above, the suction line friction losses at 190 gpm and at the pump-rated flow (110 gpm) are in Equations 4 and 5.
From the above, the friction losses in the discharge line can be determined by subtracting the total system friction Hfr from the suction line friction as shown in Equation 6.
Since the discharge line friction losses were calculated, the equivalent friction length of the discharge piping can be approximated based on the known pipe diameter and the flow rate inside the pipe. Using these two inputs in any pipe friction software, the friction of 100 ft. of 4-inch pipe with 190 gpm is calculated to 7.2 ft. Thus, the discharge line equivalent friction length can be calculated based on Equation 7.

Using the above equivalent length of the discharge piping, the discharge piping friction at any flow rate can be calculated using any piping fraction software.
As such, the system resistance curve can be plotted based on the calculated values in Image 6.
Pump Curve
As the provided pump factory performance by the vendor does not reach the 190 gpm flow, an extrapolation was done to determine the pump performance at the existing high-flow operation. To determine the accurate curve, plotting the original manufacturing performance curve was needed and obtained by using LINEST Equation in Excel. The equation that represents the pump head curve can be approximated to be a three-degree polynomial. Equation 8 shows the polynomial that best fit the factory test.
Using this polynomial, the pump performance at high flow rates can be estimated.
Pump & System Curves
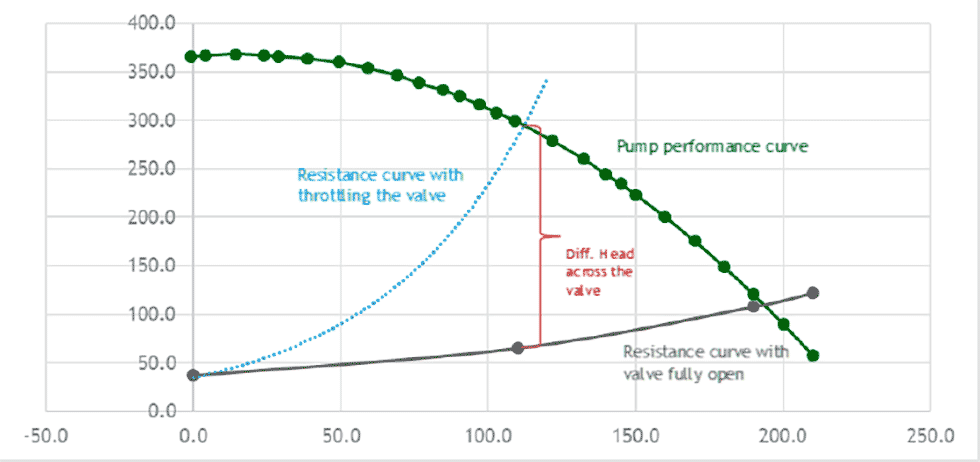
Image 7 shows the manufacturing curve (green) and the resistance curve (red) for the current situation on-site with the discharge valve fully open. Keep in mind that the pumps have four stages.
In addition, the blue line shows the system curve, assuming the discharge globe valve is partially closed. The approximate differential pressure across the valve is 234 ft. This is a high differential for the existing valve, which is not capable of meeting the requirements.
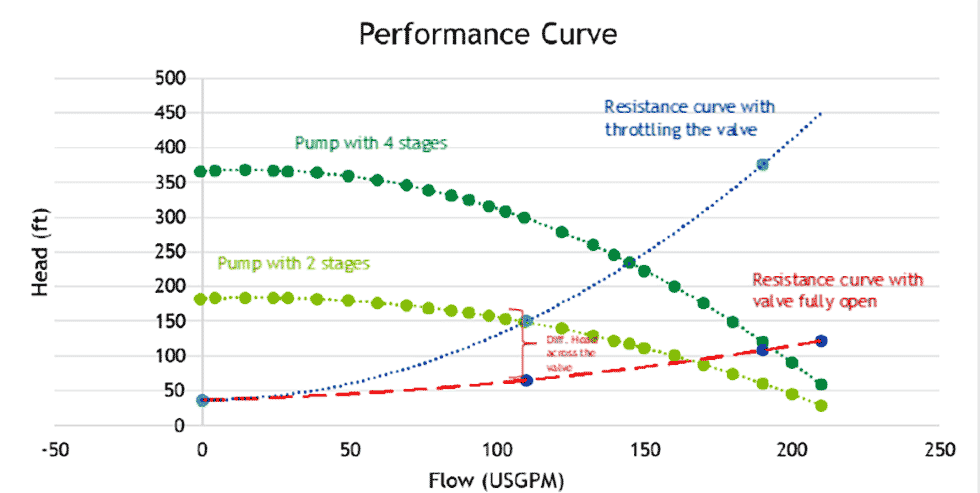
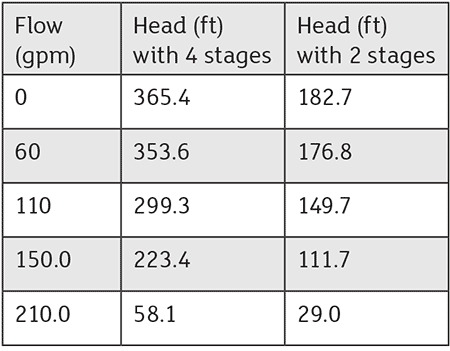
Image 8 shows the ideal situation if the pump is de-staged from four impellers to two impellers (in light green).
In addition, the blue line shows the system curve when the pump is de-staged and the discharge globe valve is partially closed. The approximate differential pressure across the valve is 85 ft. Refer to the raw calculation in Image 9.
Main Findings
The investigation of the process design showed high overestimation for the required differential head due to incorrect design that missed the presence of the gas/vapor equalizing line between the top of the truck and the top of the vessel. As per the process data, the propane vapor pressure changes significantly from winter to summer. As such, it seems the original design was done while considering the lowest vapor pressure in the truck (in winter) and the highest vapor pressure in the vessel (in summer), which is not correct. As the two will always be connected using an equalizing line, the variation in the vapor pressure will be insignificant and should not be considered in the pump differential head sizing.
Recommendations
It was recommended to de-stage the pump from four to two impellers and throttle the discharge valve to remove approximately 85 ft. It was determined that the valve should be throttled until the flow reaches 110 gpm. It was also determined that the valve be designed for continuous throttling to ensure no internal damage. If the valve inner coating was not designed for such scenarios, further action would need to be considered by the plant. For de-staging, the first impeller must be kept.
Benefits From De-Staging
Some of the benefits from de-staging the pump to two stages include:
- reducing maintenance costs
- running the pump at its original parameters
- increasing reliability of the system
- reducing power consumption
