

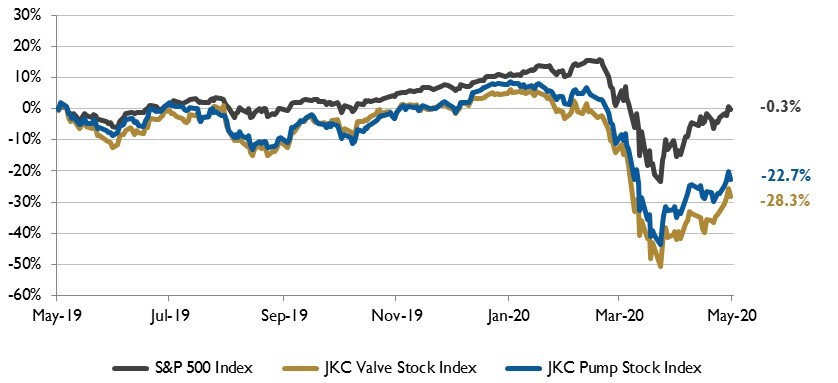
The Jordan Knauff & Company (JKC) Valve Stock Index was down 28.3 percent over the last 12 months, while the broader S&P 500 Index was down 0.3 percent. The JKC Pump Stock Index fell 22.7 percent for the same time period.
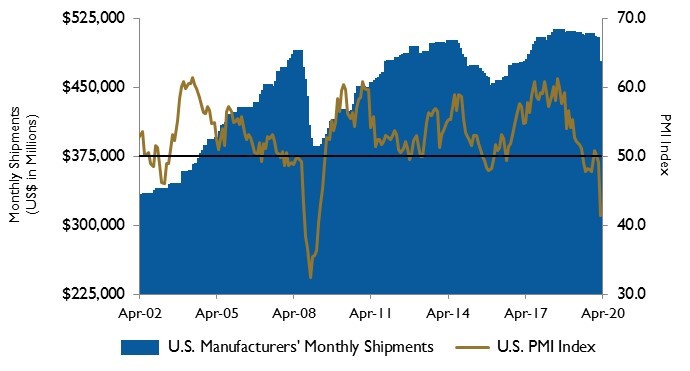
The Institute for Supply Management’s Purchasing Managers’ Index (PMI) fell to 41.5 percent in April from 49.1 percent in March, the lowest level since April 2009. Sixteen of the 18 industries tracked reported declines, only paper products and foods products rose in April. The index for new orders dropped 15.1 points to 27.1 percent, the biggest monthly drop since 1951. Production fell 20.2 points to 27.5 percent, the lowest level on record.
Gross domestic product in the United States declined at an annualized rate of 4.8 percent in the first quarter of the year. Real personal consumption expenditures dropped 7.6 percent, the steepest rate of decline in forty years. Due to the surge in spending at grocery stores, purchases of non-durable goods jumped 6.9 percent, while spending on big-ticket durable goods fell 16.1 percent.
Spending on services, which generally grows even during recessions, slumped more than 10 percent. Business spending on equipment fell more than 15 percent. Residential investment spending jumped 21 percent, reflecting strength in the housing market in the first two months of the year.
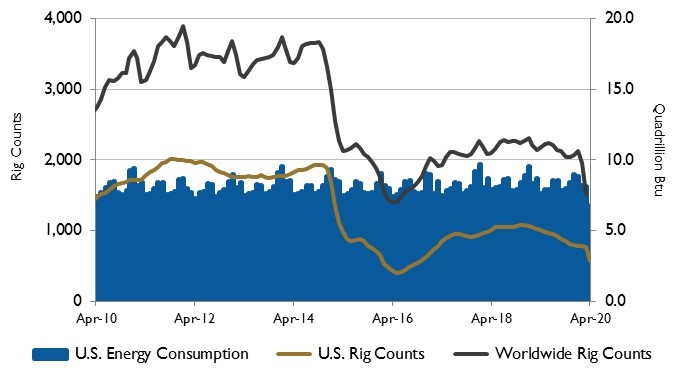
U.S. consumption of petroleum products fell to its lowest level in decades due to the economic slowdown induced by the coronavirus. The U.S. Energy Information Administration (EIA) estimates total petroleum demand averaged 14.1 million barrels per day (b/d) in the week ending April 17, up slightly from 13.8 million b/d in the previous week—the lowest level in EIA’s weekly data series going back to the early 1990s.
The most recent value is 31 percent lower than the average from January through March 13 (when a national emergency was declared).
Recent declines in demand for petroleum products have contributed to record increases in U.S. commercial crude oil inventories. From March 13 to April 24, U.S. commercial crude oil inventories increased by 16 percent (74 million barrels) and are now 8 million barrels below the record high set in March 2017, according to the EIA. Commercial crude oil inventories for the week ending April 10 increased by 19.2 million barrels, the largest weekly change in EIA’s data.
On Wall Street, the Dow Jones Industrial Average rose 11.1 percent, the S&P 500 Index gained 12.7 percent while the NASDAQ Composite rose 15.5 percent for the month of April. The S&P 500 Index had its third best monthly performance, while the Dow Jones Industrial Average posted its fourth best monthly performance.
In addition, the NASDAQ Composite had its best monthly performance since 2000. Despite disappointing economic data, investors' confidence was boosted by positive clinical trial data of a drug for the potential treatment of coronavirus, the gradual reduction of new cases of COVID-19 nationwide, and the prospect of opening the economy phase by phase.
Reference
The S&P Return figures are provided by Capital IQ.
