

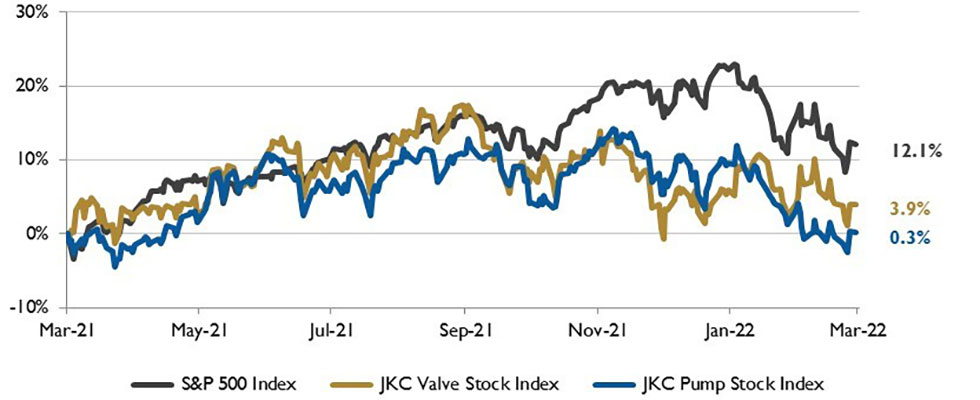
The Jordan, Knauff & Company (JKC) Valve Stock Index was up 3.9% over the last 12 months, and the broader S&P 500 index was up 12.1%. The JKC pump stock index rose 0.3% for the same period.1
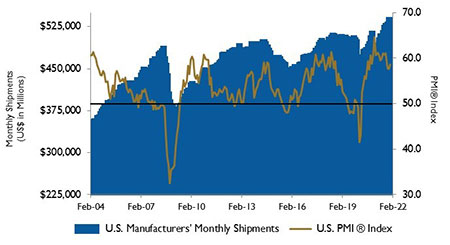
The Institute for Supply Management’s Purchasing Managers Index (PMI) rose one point to 58.6% in February. The Backlog of Orders Index was up 8.6 points and new orders rose 3.8 points, showing the continued imbalance between demand and supply.
The Production Index rose 0.7 points. Pricing pressure eased with the Prices Paid Index down a half of a percentage point to a still-high 75.6%. The Employment Index fell 1.6 points to 52.9%, a five-month low.
Some key inputs used in manufacturing semiconductors come out of Russia and Ukraine, which means the current conflict could exacerbate the existing shortage of chips. However, the U.S. manufacturing sector’s direct exposure to the conflict could be minimal.
The U.S. added 678,000 jobs in February. Job growth was also stronger in prior months than initially reported with 481,000 jobs added in January and 588,000 jobs in December. Employers continued to boost wages as average hourly earnings of private sector workers rose one cent from a month earlier. Hourly pay has risen 5.1% over the past 12 months. The unemployment rate fell from 4.0% to 3.8%.
U.S. inflation reached a four-decade high in January, accelerating to a 7.5% annual rate as strong consumer demand met with pandemic-related supply disruptions. Prices were up sharply for some everyday items, including food, vehicles, shelter and electricity.
A sharp uptick in housing rental prices, one of the biggest monthly costs for households, contributed to January’s increase. Used car prices continued to drive overall inflation, rising 40.5% in January from a year ago. Food prices rose 7%, the sharpest rise since 1981. Energy prices jumped 27%, down from November’s peak of 33.3%.
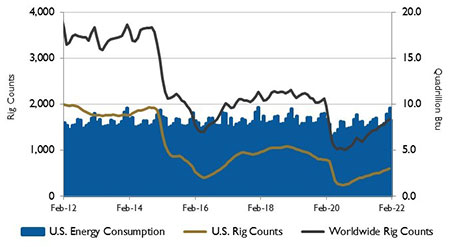
Following reports that Russian forces invaded Ukraine, the front-month futures price of both Brent and West Texas Intermediate (WTI) crude oil increased to more than $100 per barrel (b) on Feb. 24. The front-month Brent contract price closed below $115/b on March 2. The Brent crude oil price last rose above $100/b in late 2014.
The U.S. became Europe’s largest source of liquefied natural gas (LNG) in 2021, accounting for 26% of all LNG imported by European Union member countries and the United Kingdom. Qatar supplied another 24%, while Russia supplied 20%. Pipeline flows of natural gas from Russia decreased during 2021.
On Wall Street, the Dow Jones Industrial Average, the S&P 500 Index and the NASDAQ Composite fell 3.5%, 3.1% and 3.4%, respectively, in February. The Federal Reserve Bank’s next interest rate move, inflation and the conflict between Russia and Ukraine have impacted investors.
1 - The S&P Return figures are provided by Capital IQ.
