

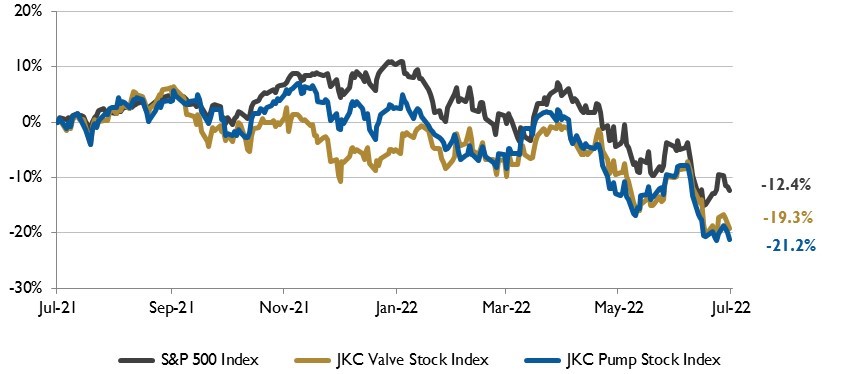
The Jordan, Knauff & Company (JKC) Valve Stock Index was down 19.3% over the last year, and the broader S&P 500 index was down 12.4%. The JKC pump stock index fell 21.2% for the same period.1
The Institute for Supply Management’s Purchasing Managers Index (PMI) fell to 53.0% in June, its lowest reading in two years. New orders fell 5.9 percentage points to 49.2%, the first contraction reading since May 2020, while new export orders fell by 2.2 percentage points to 50.7%.
The production index increased to 54.9%. The employment index fell 2.3 percentage points to 47.3%. The prices paid component dropped 3.7 percentage points to 78.5%. Survey respondents continue to note supply chain and pricing issues as their biggest concerns but remain optimistic regarding demand.
The Labor Department reported that the consumer price index (CPI) increased 8.6% in May year over year, its fastest growth since 1981. The increase was driven by rises in the prices for energy, which rose 34.6% from a year earlier, and groceries, which rose 11.9% over last year, the biggest increase since 1979. The gasoline index increased 48.7%.
Energy prices rose in May as the war in Ukraine increased prices for crude oil and natural gas. The annual rate of inflation has risen sharply since early 2021 when the U.S. economy’s rebound from the pandemic accelerated.
New orders for manufactured durable goods increased $1.9 billion in May or 0.7% to $267.2 billion. Following a 0.4% rise in April, durable goods have increased seven of the last eight months.
Transportation equipment, up for two consecutive months, led the increase rising 0.8% to $87.6 billion followed by capital goods at 0.8%, machinery at 1.1% and computer and electronics at 0.5%.
Excluding transportation, new orders increased 0.7%. Excluding defense, new orders increased 0.6%.
Liquefied natural gas (LNG) imports in the European Union and United Kingdom set a record high in April, averaging 16.5 billion cubic feet per day (Bcf/d). Europe’s LNG imports increased in 2022 due to historically low levels of natural gas storage inventories from fall 2021 through spring 2022.
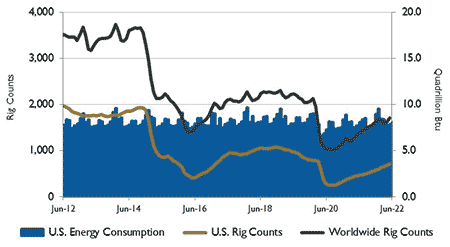
Source: U.S. Energy Information Administration and Baker
Hughes Inc.
Natural gas spot prices at major European hubs have generally been higher than spot prices in other markets. The higher spot prices in Europe have resulted in more imports from suppliers with flexibility in their contracts, particularly the United States.
Currently, 14 countries in Europe have LNG import facilities; however, utilization of these facilities varies by region.
On Wall Street, the Dow Jones Industrial Average and the S&P 500 Index dropped 6.7% and 8.4%, while the Nasdaq Composite fell 9.4% in June. Investors were concerned about high inflation, a possible recession and slowing economic growth.
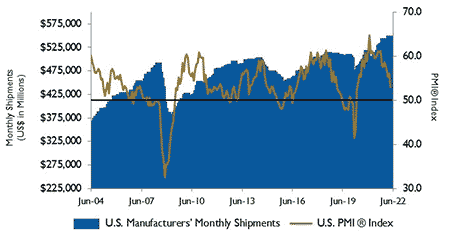
Source: Institute for Supply Management Manufacturing Report
on Business and U.S. Census Bureau
The Dow Jones Industrial Average fell 15.3% in the first half of the year, the S&P 500 Index fell 20.6%, while the Nasdaq Composite dropped 29.5%.
Reference
1 - The S&P Return figures are provided by Capital IQ.
