

The Jordan Knauff & Company (JKC) Valve Stock Index was down 4.0 percent over the last twelve months, while the broader S&P 500 Index was up 10.8 percent. The JKC Pump Stock Index fell 0.1 percent for the same time period.1
The Institute for Supply Management’s Purchasing Managers’ Index (PMI) October reading registered 48.3 percent, an increase of 0.5 percentage points from the September reading of 47.8 percent. October was the third consecutive month of PMI contraction, although at a slower rate compared to September.
The New Orders Index registered 49.1 percent, an increase of 1.8 percentage points from the prior month. The New Export Orders Index registered 50.4 percent, a 9.4 percentage point increase from the September reading of 41 percent.
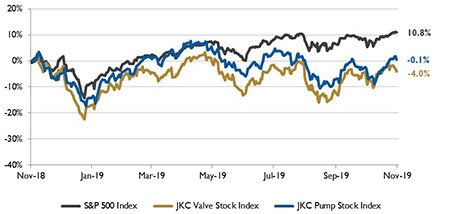
Image 1. Stock indices from Nov. 1, 2018 to Oct. 31, 2019. Local currency converted to USD using historical spot rates. The JKC Pump and Valve Stock Indices include a select list of publicly traded companies involved in the pump and valve industries, weighted by market capitalization. Source: Capital IQ and JKC research.
Comments from the panel surveyed reflect an improvement from the prior month, but sentiment remains more cautious than optimistic. Global trade remains the most significant issues across all industries. Of the 18 manufacturing industries, only five reported growth in October. Food, beverage and tobacco products remained the strongest industry sector, while transportation equipment was the weakest sector.
U.S. gross domestic product rose at an annual rate of 1.9 percent from July through September, a slight slowdown from second quarter growth of 2.0 percent. The growth rate was boosted by government and consumer spending, residential investment and exports. Consumer spending moderated to a 2.9 percent annual rate in the third quarter, from a 4.6 percent rate in the second quarter. The pace of exports picked up to a 0.7 percent annual rate after a decline in the second quarter. Nonresidential fixed investment, including business spending on software, research and development, equipment and structures, fell at a 3.0 percent rate. There was a sharp 15.3 percent drop in spending on structures.
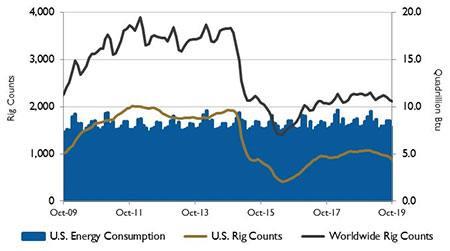
Image 2. U.S. energy consumption and rig counts. Source: U.S. Energy Information Administration and Baker Hughes Inc.
In the first half of 2019, increased exports of propane and distillate offset decreased exports of all other petroleum products. The United States exported an average of 5.47 million barrels per day of petroleum products in the first half of the year, an increase of 0.3 percent over the first half of 2018. This was the slowest year-over-year growth rate for any half year in 13 years. Slowing global economic growth and lower U.S. refinery runs in the first half of 2019 compared with the first half of 2018, limited the demand for petroleum products. Distillate, used in transportation, manufacturing, agriculture, residential and commercial activities, remained the largest U.S. petroleum product export over this time period, averaging 1.3 million barrels per day, an increase of 5 percent compared with the first half of 2018.
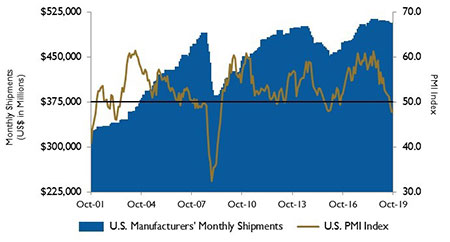
Image 3. U.S. PMI and manufacturing shipments. Source: Institute for Supply Management Manufacturing Report on Business and U.S. Census Bureau
On Wall Street, the Dow Jones Industrial Average increased 0.5 percent, the S&P 500 Index rose 2.0 percent and the NASDAQ Composite gained 3.7 percent in October. A third rate cut in a row this year by The Federal Reserve Bank helped benchmarks gain traction, as well as the 1.9 percent growth rate of the U.S. economy. Trade tensions continued to concern investors, in spite of better-than-expected earnings from top companies.
Reference
1. The S&P Return figures are provided by Capital IQ.
These materials were prepared for informational purposes from sources that are believed to be reliable but which could change without notice. Jordan, Knauff & Company and Pumps & Systems shall not in any way be liable for claims relating to these materials and makes no warranties, express or implied, or representations as to their accuracy or completeness or for errors or omissions contained herein. This information is not intended to be construed as tax, legal or investment advice. These materials do not constitute an offer to buy or sell any financial security or participate in any investment offering or deployment of capital.
