

The Jordan Knauff & Company (JKC) Valve Stock Index was up 5.1% over the last 12 months, and the broader S&P 500 index was down 19.9%. The JKC pump stock index fell 14.7% for the same time period.1
The Institute for Supply Management’s Purchasing Managers Index (PMI) declined to 48.4% in December from 49.0% in November. With the largest monthly change, the Prices Index fell 3.6 percentage points to 39.4%, the lowest reading since April 2020.
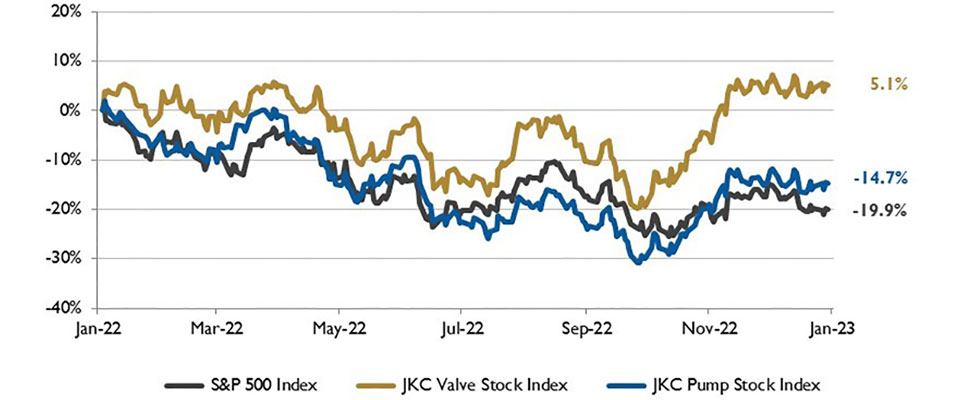
Local currency converted to USD using historical spot rates. The JKC Pump and Valve Stock Indices include a select list of publicly traded companies involved in the pump & valve industries, weighted by market capitalization. Source: Capital IQ and JKC research.
The New Orders Index remained in contraction territory at 45.2%. The Production Index fell to 48.5%, a three percentage point decrease compared to November. The Employment Index returned to expansion territory up three percentage points to 51.4% after contracting in November. The New Export Orders Index reading of 46.2% percent was down 2.2 percentage points compared to the prior month.
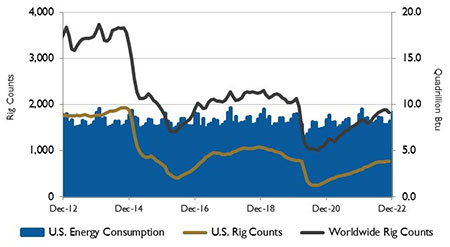
Source: U.S. Energy Information Administration and Baker
Hughes Inc.
United States employment increased by 223,000 jobs in December. Employment in manufacturing added 8,000 jobs, as gains in durable goods (+24,000) were partially offset by losses in nondurable goods (-16,000). In 2022, manufacturing added an average of 32,000 jobs per month, compared with the average of 30,000 jobs per month in 2021.
Total payroll employment rose by 4.5 million jobs in 2022 (an average monthly gain of 375,000 jobs), less than the increase of 6.7 million jobs in 2021 (an average monthly gain of 562,000). Hourly wages grew at the slowest annual pace in 16 months and has dropped by a full percentage point since the end of the first quarter of 2022. Weekly average earnings gained 3.1%, the slowest pace since May 2021.
During the first half of 2022, the United States became the world’s largest liquefied natural gas (LNG) exporter. Compared with the second half of 2021, U.S. LNG exports increased by 12% in the first half of 2022, averaging 11.2 billion cubic feet per day (Bcf/d). This increase was due to increased U.S. LNG export capacity, increased international natural gas and LNG prices, and increased global demand, particularly in Europe.
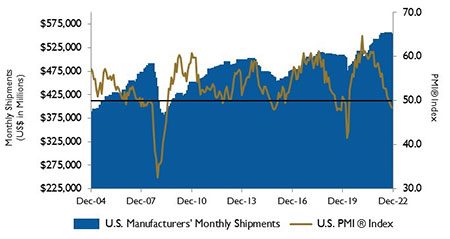
Source: Institute for Supply Management Manufacturing Report
on Business and U.S. Census Bureau
Since November 2021, installed LNG export capacity in the U.S. expanded by 1.9 Bcf/d. Most U.S. LNG exports (64%) went to the European Union and the United Kingdom during the first five months of last year. International natural gas and LNG prices hit record highs in the last quarter of 2021 and first half of 2022.
On Wall Street for the month of December the Dow Jones Industrial Average fell 4.2%, the S&P 500 Index lost 5.9% and the NASDAQ Composite was down 8.7%. For the fourth quarter of the year, the Dow rose 15.4%, the S&P 500 grew 7.1% while the NASDAQ declined 1%.
The markets finished the year with their worst results since 2008. The Dow closed down 8.8%, the S&P 500 fell 19.4% and the NASDAQ dropped 33.1%.
Reference
1 - The S&P Return figures are provided by Capital IQ.
