Pump Market Analysis

The Jordan, Knauff & Company (JKC) Valve Stock Index was up 12.4 percent over the last 12 months, while the broader S&P 500 Index was up 4.5 percent. The JKC Pump Stock Index increased 9.7 percent for the same time period.1

The Institute for Supply Management’s Purchasing Managers’ Index (PMI) increased to 53.2 percent in November, up 1.3 percentage points from October, growing for the third straight month. The Production Index rose 1.4 percentage points to 56, the highest level since January 2015. The New Orders Index improved to 53 percent from 52.1 percent in October

Survey respondents were positive, with a plastics and rubber product manufacturer noting, “We are foregoing our shutdown over Christmas break due to an increase in customer orders.” Another manufacturer wrote, “Business conditions are good.”

Stock Indices
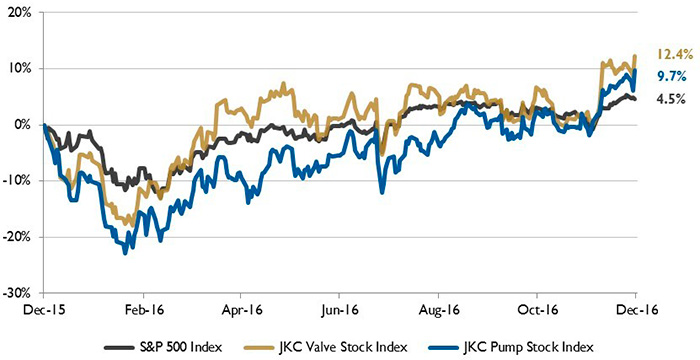
Figure 1. Stock indices from Dec. 1, 2015, to Nov. 30, 2016 Source: Capital IQ and JKC research. Local currency converted to USD using historical spot rates. The JKC Pump and Valve Stock Indices include a select list of publicly traded companies involved in the pump and valve industries weighted by market capitalization.

The Commerce Department reported that U.S. gross domestic product (GDP) rose at a 3.2 percent annual rate in the third quarter of 2016. Following the second quarter’s 1.4 percent annual rate, this was the strongest growth since the third quarter of 2014. Consumer spending, which accounts for more than two-thirds of U.S. economic activity, increased at a 2.8 percent rate, a slowdown from the second quarter’s 4.3 percent pace.

Business spending on equipment fell at a 4.8 percent rate, marking four straight quarters of decline in equipment spending. Investment in residential construction fell at a 4.4 percent annual rate. Spending on nonresidential structures, including oil and gas wells, increased at a 10.1 percent rate, the fastest pace since the first quarter of 2014.

Energy Consumption and Rig Counts
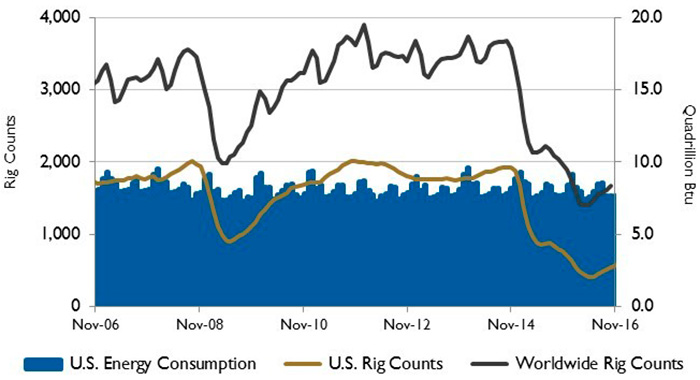
Figure 2. U.S. energy consumption and rig counts. Source: U.S. Energy Information Administration and Baker Hughes Inc.

At the end of November, the Organization of Petroleum Exporting Countries (OPEC) agreed to its first crude oil production cuts in eight years, hoping to reduce record global oil inventories that have contributed to record low oil prices. OPEC will reduce oil output by 1.2 million barrels a day by January, cutting its production to 32.5 million barrels a day. Saudi Arabia, the group’s largest producer, will reduce output by 486,000 barrels per day, while its second largest producer, Iraq, will cut output by 210,000 barrel a day. Iran was allowed to raise output to about 3.8 million barrels a day as it recovers from international sanctions. Russia, the largest non-OPEC producer, also agreed to cut its production by as much as 300,000 barrels per day.

Benchmark oil prices gained as much as 10 percent on the news and share prices of energy companies around the world jumped along with the currencies of large export countries.

U.S. PMI and manufacturing shipments
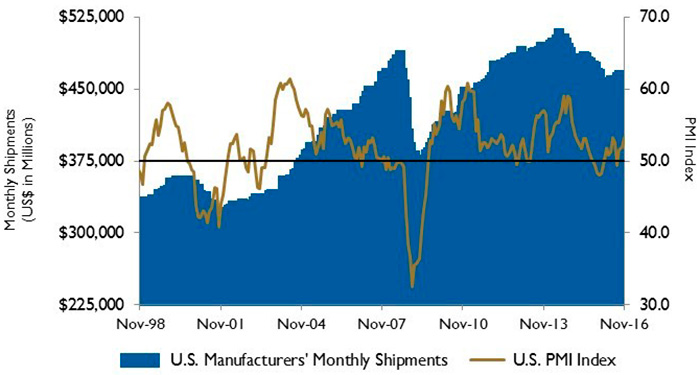
Figure 3. U.S. PMI and manufacturing shipments Source: Institute for Supply Management Manufacturing Report on Business and U.S. Census Bureau

On Wall Street, all three major U.S. indices were up for November. The Dow Jones Industrial Average was up 5.4 percent (its largest monthly gain since March), the S&P 500 Index gained 3.4 percent and the NASDAQ Composite increased 2.6 percent. Solid economic data including consumer confidence, housing starts and GDP gains, along with OPEC’s decision, bolstered investors’ sentiment. Third quarter corporate earnings were also positive, up 4 percent over the same period last year.

Reference

  1. The S&P Return figures are provided by Capital IQ.

These materials were prepared for informational purposes from sources that are believed to be reliable but which could change without notice. Jordan, Knauff & Company and Pumps & Systems shall not in any way be liable for claims relating to these materials and makes no warranties, express or implied, or representations as to their accuracy or completeness or for errors or omissions contained herein. This information is not intended to be construed as tax, legal or investment advice. These materials do not constitute an offer to buy or sell any financial security or participate in any investment offering or deployment of capital.