Pump Market Analysis
Jordan, Knauff & Company

The Jordan, Knauff & Company (JKC) Valve Stock Index was up 16.7 percent over the last 12 months, while the broader S&P 500 Index was up 14.8 percent. The JKC Pump Stock Index increased 21.7 percent for the same time period.1

The Institute for Supply Management’s Purchasing Managers’ Index (PMI) increased slightly to 54.9 percent in May compared to 54.8 percent in April. New orders (rising to 59.5 percent from 57.5 percent) and employment (increasing to 53.5 percent from 52.0 percent) grew at a faster pace during the month. However, both production (decreasing from 58.6 percent to 57.1 percent) and exports (falling from 59.5 percent to 57.5 percent) eased for the month, but still remained in positive territory. The production index is currently slightly above its 12-month average.

Stock indices from June 1, 2016 to May 31, 2017
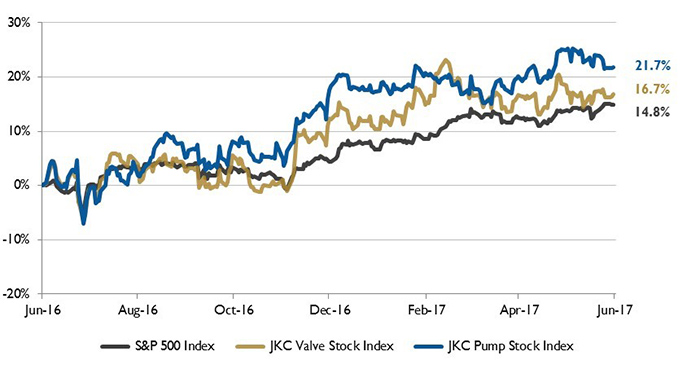
Figure 1. Stock indices from June 1, 2016 to May 31, 2017. Local currency converted to USD using historical spot rates. The JKC Pump and Valve Stock Indices include a select list of publicly traded companies involved in the pump and valve industries weighted by market capitalization. Source: Capital IQ and JKC research.

The global manufacturing sector continued to expand in May with the J.P. Morgan Global Manufacturing PMI reaching 52.6 percent. The index was down slightly for the month, but is still above the long-term average of 51.4 percent. Developed nations generally outperformed emerging markets. The United Kingdom PMI for May was close to April’s three-year high, while the Euro area hit a six-year high and Japan reached a three-month high. The China PMI fell below the 50.0 percent expansion mark for the first time in 11 months.

The U.S. Commerce Department reported that payrolls increased by 138,000 in May with solid gains in business services, education and health services, and leisure and hospitality. Construction industry jobs increased by 11,000, while the manufacturing sector lost 1,000 jobs during the month. The number of Americans employed overall fell from 153.2 million in April to 152.9 in May, a three-month low. At its lowest level since June 2016, the participation rate dropped from 62.9 percent to 62.7 percent.

U.S. energy consumption and rig counts
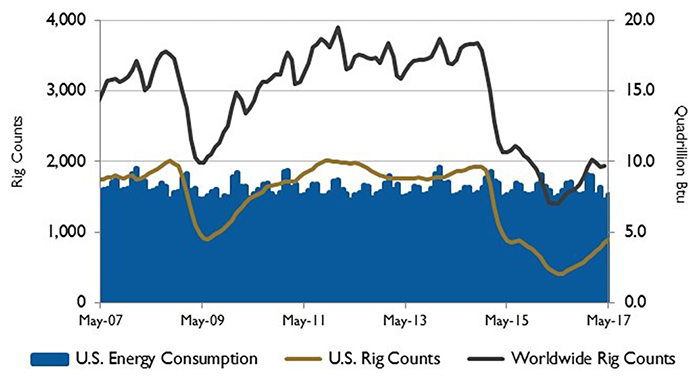
Figure 2. U.S. energy consumption and rig counts. Source: U.S. Energy Information Administration and Baker Hughes Inc.

The high level of global liquid fuels inventory compared to its five-year average may have influenced the Organization of Petroleum Exporting Countries (OPEC) to extend its crude oil production cuts through March 2018. The voluntary cuts were set to end in June. Russia is the only non-OPEC member that agreed to the extended cuts. Commercial liquid fuel inventories in the Organization of Economic Cooperation and Development (OECD) are 257 million barrels higher than the five-year average.

Even though OPEC products cuts will be partially offset by production growth in other countries, the U.S. Energy Information Administration expects that global oil inventories will decline by almost 0.2 million barrels per day this year, with the largest draws happening in the third quarter. Supply growth in the United States, Brazil and OPEC in 2018 will result in global oil inventories increasing by 0.1 million barrels per day in 2018.

U.S. PMI and manufacturing shipments
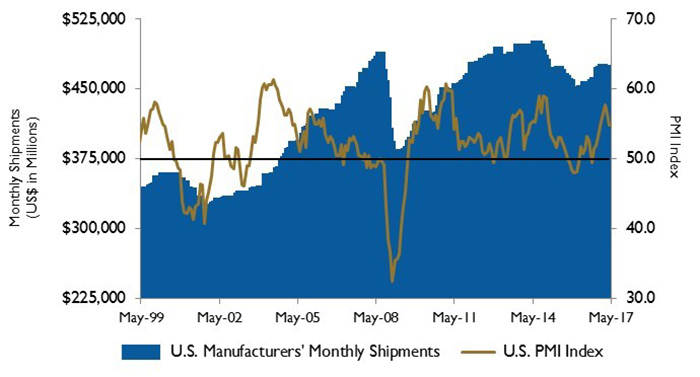
Figure 3. U.S. PMI and manufacturing shipments. Source: Institute for Supply Management Manufacturing Report on Business and U.S. Census Bureau

On Wall Street the Dow Jones Industrial Average grew 0.3 percent, the S&P 500 Index rose 1.2 percent and the NASDAQ Composite was up 2.5 percent for the month of May. The energy sector declined over concerns that major oil producing countries will not be able to enact effective production cuts needed to help stabilize the global crude oil market.

Reference
1. The S&P Return figures are provided by Capital IQ.

These materials were prepared for informational purposes from sources that are believed to be reliable but which could change without notice. Jordan, Knauff & Company and Pumps & Systems shall not in any way be liable for claims relating to these materials and makes no warranties, express or implied, or representations as to their accuracy or completeness or for errors or omissions contained herein. This information is not intended to be construed as tax, legal or investment advice. These materials do not constitute an offer to buy or sell any financial security or participate in any investment offering or deployment of capital.

Issue