Pump Market Analysis

The Jordan Knauff & Company (JKC) Valve Stock Index was down 2.6 percent over the last 12 months, while the broader S&P 500 Index was up 10.9 percent. The JKC Pump Stock Index fell 2.4 percent for the same time period.1

The Institute for Supply Management’s Purchasing Managers’ Index (PMI) registered 52.8 percent in April, a decrease of 2.5 percentage points since March, the slowest pace of growth in two and a half years. The drop can mostly be traced to employment, which dropped to 52.4 percent from 57.5 percent, and new orders, which fell 5.7 percentage points to 51.7. The fall of new orders points to a weakening in domestic demand and continued anemic growth overseas. Export orders declined to 49.5 percent.

Stock Indices from May 1, 2018 to April 30, 2019
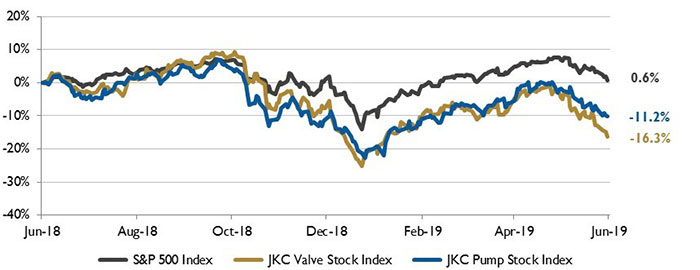
Image 1. Stock Indices from May 1, 2018 to April 30, 2019. Local currency converted to USD using historical spot rates. The JKC Pump and Valve Stock Indices include a select list of publicly traded companies involved in the pump and valve industries, weighted by market capitalization. Source: Capital IQ and JKC research.

The U.S. economy expanded at an annual rate of 3.2 percent for the first quarter of 2019, compared to a rate of 2.2 percent in the final three months of 2018. The growth was boosted by exports, which rose 3.7 percent; an increase in state and local government spending, which rose 3.9 percent; and higher private inventory investment. Consumer spending slowed from 2.5 percent in the fourth quarter of 2018 to 1.2 percent for the first quarter of 2019. Business spending on software, research and development, equipment and structures rose at a 2.7 percent rate, down from 5.4 percent in the fourth quarter. Residential investment fell at a 2.8 percent annual pace, marking the fifth straight quarter of decline.

Primary energy consumption reached a record high of 101.3 quadrillion Btus in the U.S. in 2018, up 4 percent from 2017 and 0.3 percent above the previous record set in 2007. Consumption of fossil fuels accounted for 80 percent of U.S. total energy consumption. Natural gas rose 10 percent over 2017 and reached a record high. Driven by the addition of new wind and solar power plants, renewable energy consumption hit a record high, rising 3 percent during the year. Petroleum consumption reached 20.5 million barrels per day last year due to increased use in the industrial sector.

U.S. energy consumption and rig counts
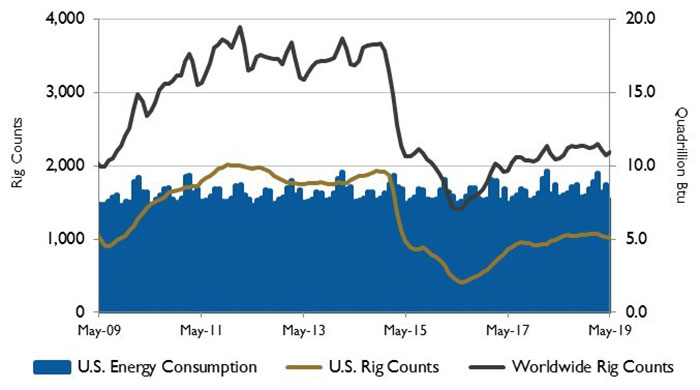
Image 2. U.S. energy consumption and rig counts. Source: U.S. Energy Information Administration and Baker Hughes Inc.

Reaching an annual average of 5.6 million barrels per day, U.S. exports of total petroleum products set a record high in 2018 for the 16th consecutive year. The three largest petroleum product exports last year were distillate, propane and motor gasoline. Propane exports were greater than gasoline exports for the third consecutive year, with Asia being three of the top five destinations. Propane is used in many Asian countries as a building block for manufacturing chemicals and plastics.

U.S. PMI and manufacturing shipments
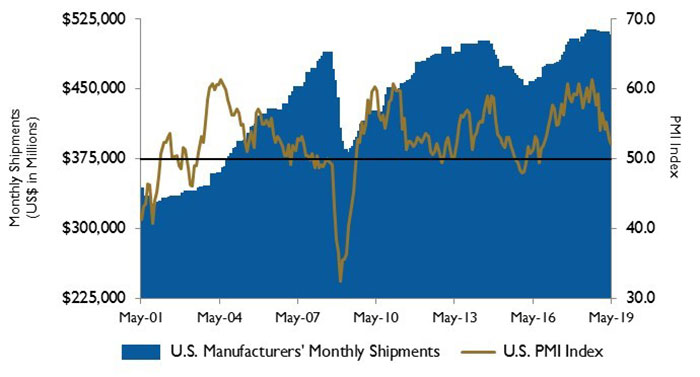
Image 3. U.S. PMI and manufacturing shipments. Source: Institute for Supply Management Manufacturing Report on Business and U.S. Census Bureau

On Wall Street, the Dow Jones Industrial Average, the S&P 500 Index and the NASDAQ Composite gained 2.6 percent, 3.9 percent and 4.9 percent, respectively. Positivity about the U.S.-China trade war and strong first-quarter corporate earnings strengthened confidence. The U.S. Consumer Confidence Index rose to 129.2 in April, up from 124.2 in March.

Reference
1. The S&P Return figures are provided by Capital IQ.

These materials were prepared for informational purposes from sources that are believed to be reliable but which could change without notice. Jordan, Knauff & Company and Pumps & Systems shall not in any way be liable for claims relating to these materials and makes no warranties, express or implied, or representations as to their accuracy or completeness or for errors or omissions contained herein. This information is not intended to be construed as tax, legal or investment advice. These materials do not constitute an offer to buy or sell any financial security or participate in any investment offering or deployment of capital.

Issue