

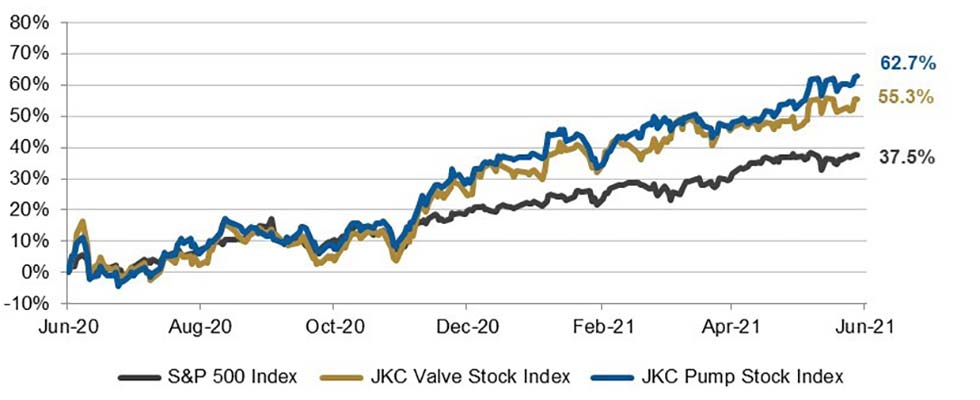
The Jordan, Knauff & Company (JKC) Valve Stock Index was up 55.3% over the last 12 months, and the broader S&P 500 index was up 37.5%. The JKC pump stock index rose 62.7%.1
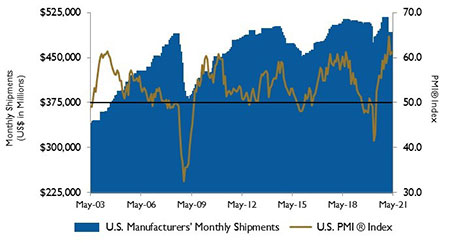
The Institute for Supply Management’s Purchasing Managers Index (PMI) increased to 61.2% in May. At 67.0%, the New Orders Index is at a roughly 17-year high.
Supplier deliveries reached the highest level since 1974 moving to 78.8%. Long wait times are having a predictable effect on output as the Production Index fell to 58.5% from 62.5%. The Employment Index experienced the largest drop of the month falling to 50.9%. Although the Prices Paid Index fell in May, at 88.0%, price pressure is still intense.
Employers added 559,000 new jobs in May with overall jobs still 7.6 million short of pre-pandemic levels. The manufacturing sector added 23,000 net jobs led by auto manufacturing, where employers added 25,000 workers. This suggests some of the semiconductor-related supply constraints in the sector may be starting to ease.
Private service employers added 489,000 jobs, led by leisure and hospitality at 292,000. Construction hiring fell for the second-consecutive month, with payrolls falling 20,000. Despite the demand for workers, labor force participation fell to 61.6% and continues to be well below its pre-pandemic rate. Falling participation contributed to the unemployment rate dropping to 5.8% from 6.1%.
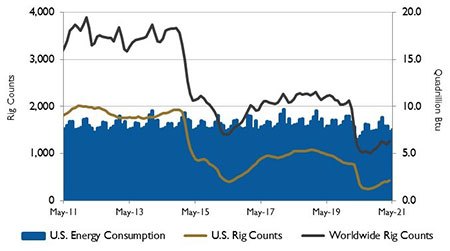
2020 marked the largest annual decrease in U.S. energy production on record, with the economic responses to the pandemic driving most of the decrease. Down more than 5% from 2019’s record high, with a drop from 101.3 quads in 2019 to 95.8 quads in 2020 in absolute terms.
U.S. crude oil production fell by 8% after reaching a record high in 2019. Natural gas dry production increased in eight of the previous nine years and hit a record high in 2019. It decreased by 2% in 2020. Production of natural gas plant liquids increased by 7%.
Renewable energy production increased by 2% between 2019 and 2020 to a record high of 11.8 quads, primarily due to increased electricity generation from wind and solar. U.S. coal production fell by 25%, its largest annual decrease on record.
Brent crude oil prices were higher in May as global oil inventories continued to decline but at a slower pace than in the first four months of the year. Brent crude oil spot prices averaged $68 per barrel in May, up $4 per barrel from April. It is expected that Brent prices will remain near current levels in the third quarter and fall to an average of $60 per barrel in 2022.
On Wall Street, the Dow Jones Industrial Average was up 1.9% in May, the S&P 500 Index rose 0.6% and the NASDAQ Composite was down 1.5%. Core personal consumption expenditure (PCE) inflation (which excludes food and energy prices) climbed 3.1% in April and 1.9% in March, showing the highest monthly gain in 29 years.
Read more Pump Market Analysis pieces here.
