

The Jordan, Knauff & Company (JKC) Valve Stock Index was down 10% over the last 12 months, and the broader S&P 500 index was down 1.6%. The JKC pump stock index fell 13.2% in the same period.1
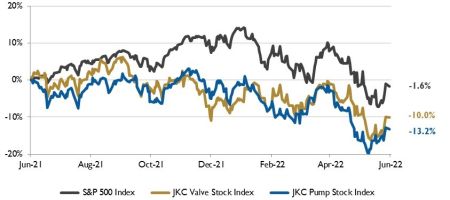
Local currency converted to USD using historical spot rates. The JKC Pump and Valve Stock Indices include a select list of publicly traded companies involved in the pump & valve industries, weighted by market capitalization. Source: Capital IQ and JKC research.
The Institute for Supply Management’s Purchasing Managers Index (PMI) rose to 56.1% in May from 55.4% a month earlier. New orders rose to 55.1% and order backlogs climbed to 58.7%.
Customer inventories fell to 32.7%, the 4.4 percentage point drop was the largest decline in six months and the largest drop of any component in May.
Survey respondents from the transportation equipment and fabricated metal products industries specifically cited China COVID lockdowns as contributing to worsening supply issues and longer lead times. Imports fell into contraction territory at 48.7%, the lowest reading since the onset of the pandemic. While 30% of respondents expressed difficulty in filling positions, the employment index fell into contraction territory at 49.6%.
The prices paid component was above 80% for the third straight month. The 82.2% reading in May was down from 84.6% in April. High demand and limited supply are keeping pressure on inflation.
Employment in the United States rose by 390,000 jobs in May, and the unemployment rate remained at 3.6%. Notable job gains occurred in leisure and hospitality (up 84,000), professional and business services (up 75,000) and transportation and warehousing (up 47,000).
Manufacturing employment continued to trend up in May, adding 18,000 jobs.
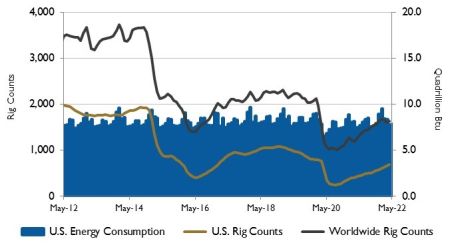
Source: U.S. Energy Information Administration and Baker
Hughes Inc.
Crude oil prices increased at the end of May as COVID restrictions eased in China and the European Union announced it will reduce crude oil imports from Russia by 90% by the end of 2022.
These factors contributed to upward pressure on prices that have been high because of low inventory levels and uncertain supply from Russia following its invasion of Ukraine. The Brent crude oil spot price averaged $113 per barrel (b) in May. The Brent price is expected to average $108/b in 2022 and then fall to $97/b in 2023. Rising oil prices have contributed to inflation.
It is estimated that world production of petroleum has returned to within 1% of its pre-pandemic level. U.S. production of crude oil and other liquids in May was within 3% of January 2020’s record high production. It is also estimated that OPEC crude oil and other liquids production has returned to pre-pandemic levels.
The Dow Jones Industrial Average and the S&P 500 Index dropped 0.2% and 0.6%, while the Nasdaq Composite fell 3.6% in May. The markets have been volatile in recent months due to inflation, tightening monetary policies by the Federal Reserve Bank and fear of recession.
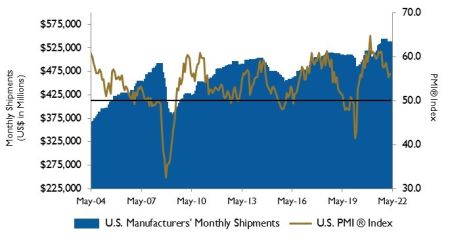
Source: Institute for Supply Management Manufacturing Report
on Business and U.S. Census Bureau
In addition, comments from the Federal Reserve Bank about indefinite half percentage point hikes depressed investor confidence. The unstable oil market also caused concern for investors.
Reference
1 - The S&P Return figures are provided by Capital IQ.
