
The Jordan, Knauff & Company (JKC) Valve Stock Index was down 2.9 percent over the last 12 months, while the broader S&P 500 Index was up 9 percent. The JKC Pump Stock Index fell 9.9 percent for the same time period.1 The Institute for Supply Management’s Purchasing Managers’ Index (PMI) increased 1.1 percentage points to 55.3 percent in March. Comments from the survey panel reflected expanding business strength supported by gains in new orders and employment. The New Orders Index gained 1.9 percentage points rising to 57.4 percent, while the Employment Index gained 5.2 percentage points reaching 57.5 percent. The Export Orders Index fell to 51.7 percent, its lowest level in two and a half years. Growth of global manufacturing production remained weak in March according to the latest J.P. Morgan Global Manufacturing PMI. With a reading of 50.6 percent, the index was unchanged from February and is slightly above the neutral 50 percent mark. Overall, new orders stagnated and international trade flows declined. On a regional basis, PMI readings were above 50 percent in China, the United States, Brazil and the United Kingdom. Below 50 percent readings were seen in the Eurozone, Japan and South Korea. March saw a modest increase in global manufacturing employment, with staffing levels rising in China, the U.S., the Eurozone, Japan, Brazil and the U.K.
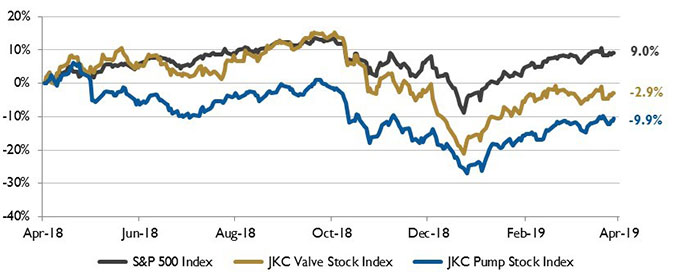 Image 1. Stock indices from April 1, 2018, to March 31, 2019. Local currency converted to USD using historical spot rates. The JKC Pump and Valve Stock Indices include a select list of publicly traded companies involved in the pump and valve industries, weighted by market capitalization. Source: Capital IQ and JKC research.
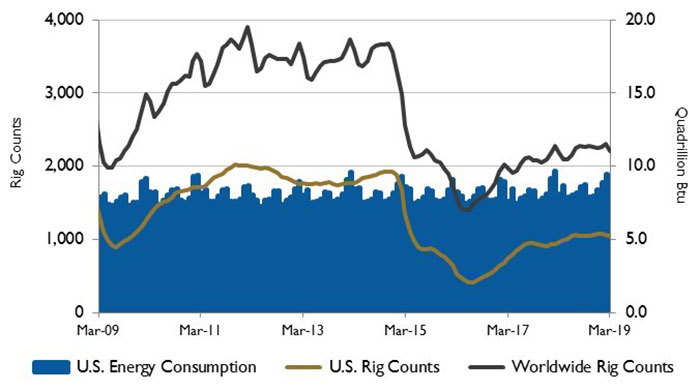 Image 2. U.S. energy consumption and rig counts. Source: U.S. Energy Information Administration and Baker Hughes Inc.
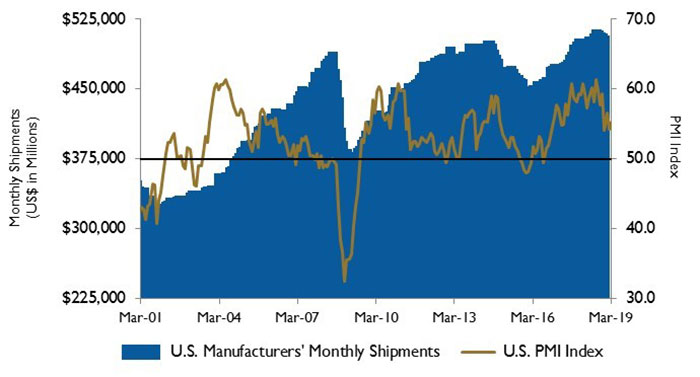 Image 3. U.S. PMI and manufacturing shipments. Source: Institute for Supply Management Manufacturing Report on Business and U.S. Census Bureau